Every research endeavor ends up with the communication of its findings. Graduate-level research culminates in a thesis defense, while many academic and scientific disciplines are published in peer-reviewed journals. In a business context, PowerPoint research presentation is the default format for reporting the findings to stakeholders.
Condensing months of work into a few slides can prove to be challenging. It requires particular skills to create and deliver a research presentation that promotes informed decisions and drives long-term projects forward.
Table of Contents
- What is a Research Presentation
- Key Slides for Creating a Research Presentation
- Tips When Delivering a Research Presentation
- How to Present Sources in a Research Presentation
- Recommended Templates to Create a Research Presentation
- Conclusion
What is a Research Presentation
A research presentation is the communication of research findings, typically delivered to an audience of peers, colleagues, students, or professionals. In the academe, it is meant to showcase the importance of the research paper, state the findings and the analysis of those findings, and seek feedback that could further the research.
The presentation of research becomes even more critical in the business world as the insights derived from it are the basis of strategic decisions of organizations. Information from this type of report can aid companies in maximizing the sales and profit of their business. Major projects such as research and development (R&D) in a new field, the launch of a new product or service, or even corporate social responsibility (CSR) initiatives will require the presentation of research findings to prove their feasibility.
Market research and technical research are examples of business-type research presentations you will commonly encounter.
In this article, we’ve compiled all the essential tips, including some examples and templates, to get you started with creating and delivering a stellar research presentation tailored specifically for the business context.
Key Slides for Creating a Research Presentation
Various research suggests that the average attention span of adults during presentations is around 20 minutes, with a notable drop in an engagement at the 10-minute mark. Beyond that, you might see your audience doing other things.
How can you avoid such a mistake? The answer lies in the adage “keep it simple, stupid” or KISS. We don’t mean dumbing down your content but rather presenting it in a way that is easily digestible and accessible to your audience. One way you can do this is by organizing your research presentation using a clear structure.
Here are the slides you should prioritize when creating your research presentation PowerPoint.
1. Title Page
The title page is the first thing your audience will see during your presentation, so put extra effort into it to make an impression. Of course, writing presentation titles and title pages will vary depending on the type of presentation you are to deliver. In the case of a research presentation, you want a formal and academic-sounding one. It should include:
- The full title of the report
- The date of the report
- The name of the researchers or department in charge of the report
- The name of the organization for which the presentation is intended
When writing the title of your research presentation, it should reflect the topic and objective of the report. Focus only on the subject and avoid adding redundant phrases like “A research on” or “A study on.” However, you may use phrases like “Market Analysis” or “Feasibility Study” because they help identify the purpose of the presentation. Doing so also serves a long-term purpose for the filing and later retrieving of the document.
Here’s a sample title page for a hypothetical market research presentation from Gillette.

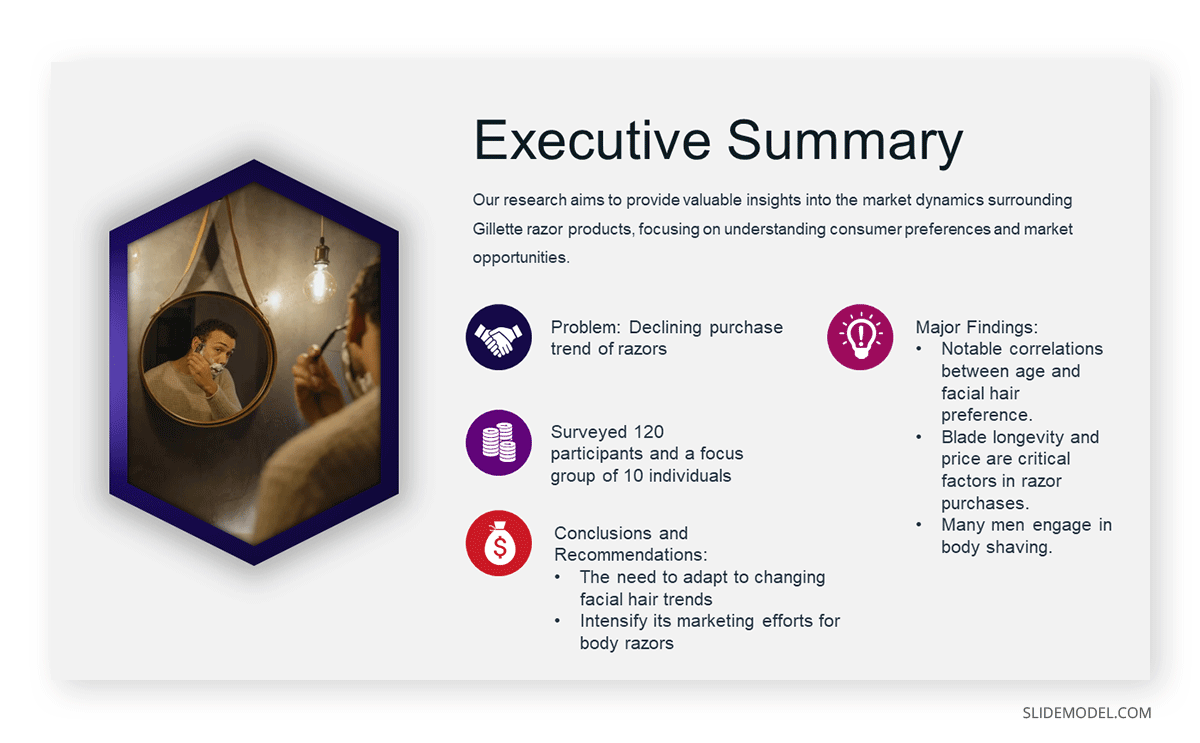
2. Executive Summary Slide
The executive summary marks the beginning of the body of the presentation, briefly summarizing the key discussion points of the research. Specifically, the summary may state the following:
- The purpose of the investigation and its significance within the organization’s goals
- The methods used for the investigation
- The major findings of the investigation
- The conclusions and recommendations after the investigation
Although the executive summary encompasses the entry of the research presentation, it should not dive into all the details of the work on which the findings, conclusions, and recommendations were based. Creating the executive summary requires a focus on clarity and brevity, especially when translating it to a PowerPoint document where space is limited.
Each point should be presented in a clear and visually engaging manner to capture the audience’s attention and set the stage for the rest of the presentation. Use visuals, bullet points, and minimal text to convey information efficiently.
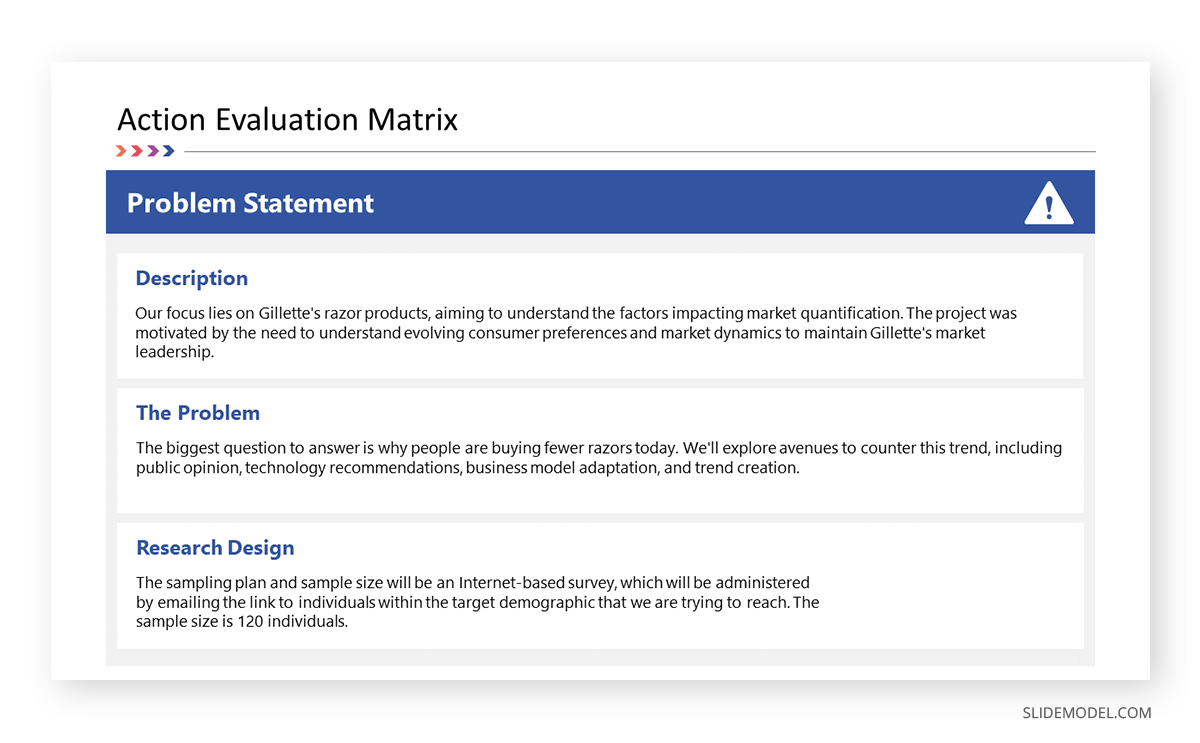
3. Introduction/ Project Description Slides
In this section, your goal is to provide your audience with the information that will help them understand the details of the presentation. Provide a detailed description of the project, including its goals, objectives, scope, and methods for gathering and analyzing data.
You want to answer these fundamental questions:
- What specific questions are you trying to answer, problems you aim to solve, or opportunities you seek to explore?
- Why is this project important, and what prompted it?
- What are the boundaries of your research or initiative?
- How were the data gathered?
Important: The introduction should exclude specific findings, conclusions, and recommendations.
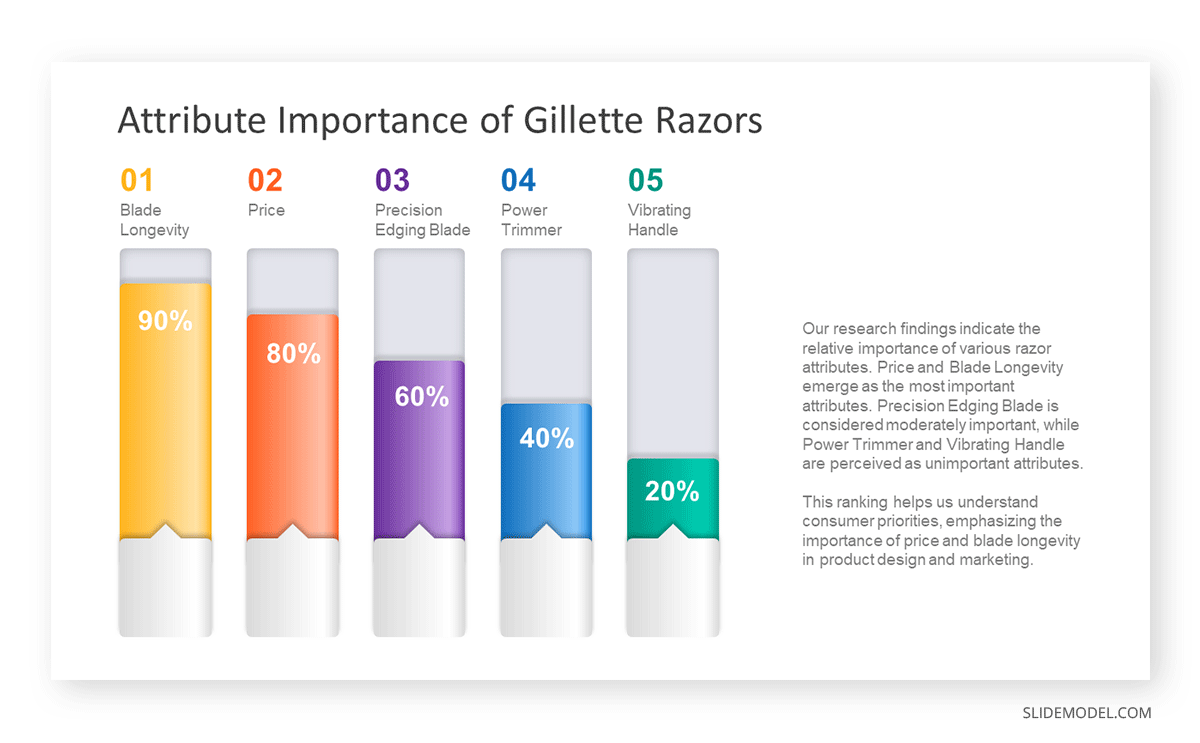
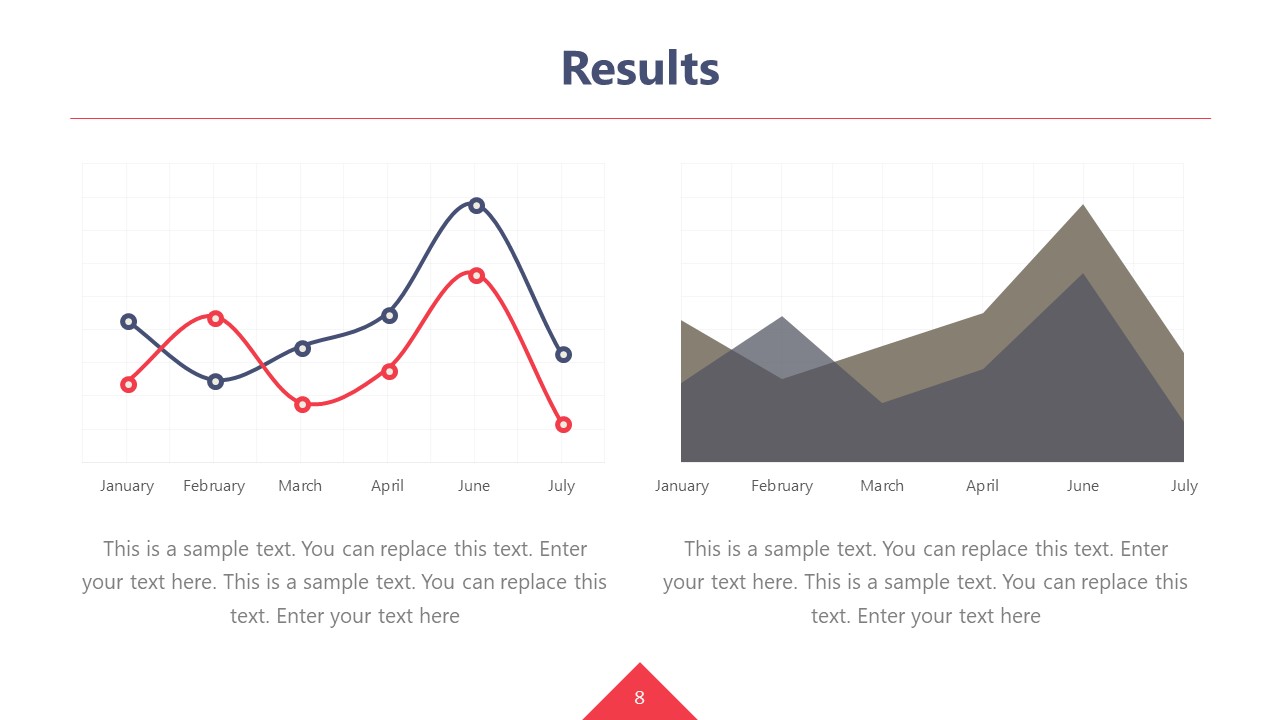
4. Data Presentation and Analyses Slides
This is the longest section of a research presentation, as you’ll present the data you’ve gathered and provide a thorough analysis of that data to draw meaningful conclusions. The format and components of this section can vary widely, tailored to the specific nature of your research.
For example, if you are doing market research, you may include the market potential estimate, competitor analysis, and pricing analysis. These elements will help your organization determine the actual viability of a market opportunity.
Visual aids like charts, graphs, tables, and diagrams are potent tools to convey your key findings effectively. These materials may be numbered and sequenced (Figure 1, Figure 2, and so forth), accompanied by text to make sense of the insights.
5. Conclusions
The conclusion of a research presentation is where you pull together the ideas derived from your data presentation and analyses in light of the purpose of the research. For example, if the objective is to assess the market of a new product, the conclusion should determine the requirements of the market in question and tell whether there is a product-market fit.
Designing your conclusion slide should be straightforward and focused on conveying the key takeaways from your research. Keep the text concise and to the point. Present it in bullet points or numbered lists to make the content easily scannable.

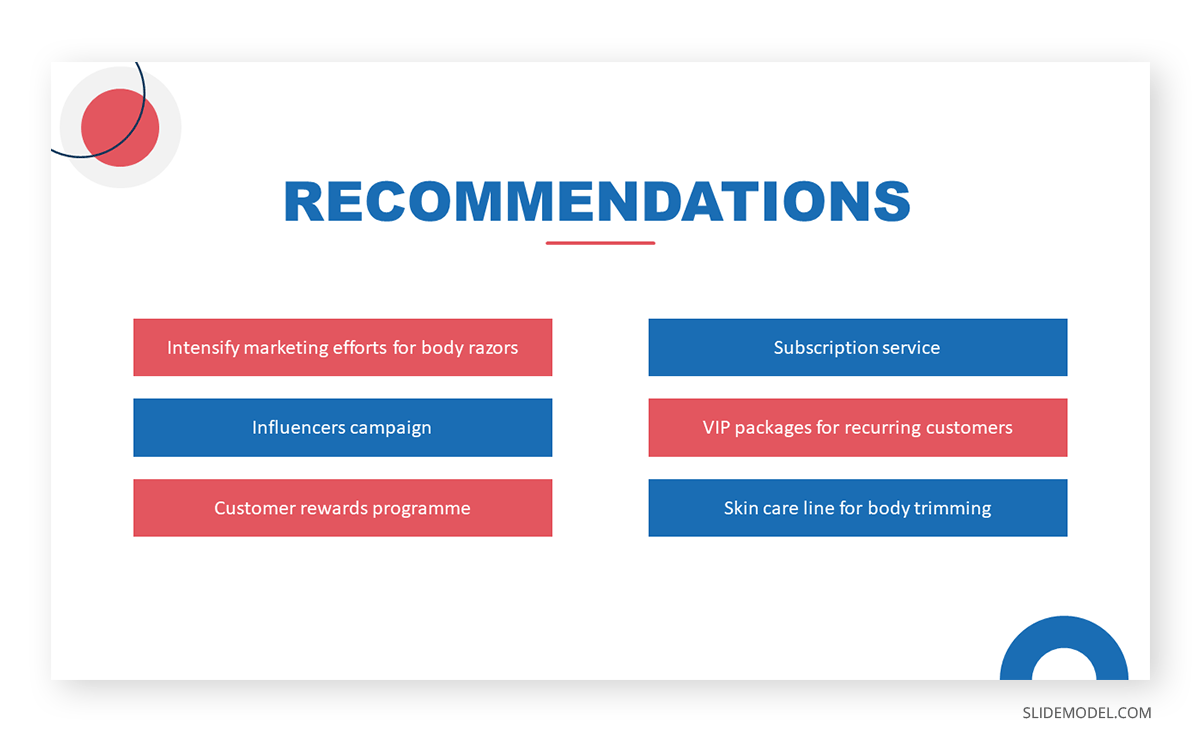
6. Recommendations
The findings of your research might reveal elements that may not align with your initial vision or expectations. These deviations are addressed in the recommendations section of your presentation, which outlines the best course of action based on the result of the research.
What emerging markets should we target next? Do we need to rethink our pricing strategies? Which professionals should we hire for this special project? — these are some of the questions that may arise when coming up with this part of the research.
Recommendations may be combined with the conclusion, but presenting them separately to reinforce their urgency. In the end, the decision-makers in the organization or your clients will make the final call on whether to accept or decline the recommendations.
7. Questions Slide
Members of your audience are not involved in carrying out your research activity, which means there’s a lot they don’t know about its details. By offering an opportunity for questions, you can invite them to bridge that gap, seek clarification, and engage in a dialogue that enhances their understanding.
If your research is more business-oriented, facilitating a question and answer after your presentation becomes imperative as it’s your final appeal to encourage buy-in for your recommendations.
A simple “Ask us anything” slide can indicate that you are ready to accept questions.
If you need a quick method to create a research presentation, check out our AI presentation maker. A tool in which you add the topic, curate the outline, select a design, and let AI do the work for you. Alternatively, check our tutorial on how to convert a research paper to presentation using AI.
Tips When Delivering a Research Presentation
1. Focus on the Most Important Findings
The truth about presenting research findings is that your audience doesn’t need to know everything. Instead, they should receive a distilled, clear, and meaningful overview that focuses on the most critical aspects.
You will likely have to squeeze in the oral presentation of your research into a 10 to 20-minute presentation, so you have to make the most out of the time given to you. In the presentation, don’t soak in the less important elements like historical backgrounds. Decision-makers might even ask you to skip these portions and focus on sharing the findings.
2. Do Not Read Word-per-word
Reading word-for-word from your presentation slides intensifies the danger of losing your audience’s interest. Its effect can be detrimental, especially if the purpose of your research presentation is to gain approval from the audience. So, how can you avoid this mistake?
- Make a conscious design decision to keep the text on your slides minimal. Your slides should serve as visual cues to guide your presentation.
- Structure your presentation as a narrative or story. Stories are more engaging and memorable than dry, factual information.
- Prepare speaker notes with the key points of your research. Glance at it when needed.
- Engage with the audience by maintaining eye contact and asking rhetorical questions.
3. Don’t Go Without Handouts
Handouts are paper copies of your presentation slides that you distribute to your audience. They typically contain the summary of your key points, but they may also provide supplementary information supporting data presented through tables and graphs.
The purpose of distributing presentation handouts is to easily retain the key points you presented as they become good references in the future. Distributing handouts in advance allows your audience to review the material and come prepared with questions or points for discussion during the presentation. Also, check our article about how to create handouts for a presentation.
4. Actively Listen
An equally important skill that a presenter must possess aside from speaking is the ability to listen. We are not just talking about listening to what the audience is saying but also considering their reactions and nonverbal cues. If you sense disinterest or confusion, you can adapt your approach on the fly to re-engage them.
For example, if some members of your audience are exchanging glances, they may be skeptical of the research findings you are presenting. This is the best time to reassure them of the validity of your data and provide a concise overview of how it came to be. You may also encourage them to seek clarification.
5. Be Confident
Anxiety can strike before a presentation – it’s a common reaction whenever someone has to speak in front of others. If you can’t eliminate your stress, try to manage it.
People hate public speaking not because they simply hate it. Most of the time, it arises from one’s belief in themselves. You don’t have to take our word for it. Take Maslow’s theory that says a threat to one’s self-esteem is a source of distress among an individual.
Now, how can you master this feeling? You’ve spent a lot of time on your research, so there is no question about your topic knowledge. Perhaps you just need to rehearse your research presentation. If you know what you will say and how to say it, you will gain confidence in presenting your work.
How to Present Sources in a Research Presentation
All sources you use in creating your research presentation should be given proper credit. The APA Style is the most widely used citation style in formal research.
In-text citation
Add references within the text of your presentation slide by giving the author’s last name, year of publication, and page number (if applicable) in parentheses after direct quotations or paraphrased materials. As in:
The alarming rate at which global temperatures rise directly impacts biodiversity (Smith, 2020, p. 27).
If the author’s name and year of publication are mentioned in the text, add only the page number in parentheses after the quotations or paraphrased materials. As in:
According to Smith (2020), the alarming rate at which global temperatures rise directly impacts biodiversity (p. 27).
Image citation
All images from the web, including photos, graphs, and tables, used in your slides should be credited using the format below.
Creator’s Last Name, First Name. “Title of Image.” Website Name, Day Mo. Year, URL. Accessed Day Mo. Year.
Work cited page
A work cited page or reference list should follow after the last slide of your presentation. The list should be alphabetized by the author’s last name and initials followed by the year of publication, the title of the book or article, the place of publication, and the publisher. As in:
Smith, J. A. (2020). Climate Change and Biodiversity: A Comprehensive Study. New York, NY: ABC Publications.
When citing a document from a website, add the source URL after the title of the book or article instead of the place of publication and the publisher. As in:
Smith, J. A. (2020). Climate Change and Biodiversity: A Comprehensive Study. Retrieved from https://www.smith.com/climate-change-and-biodiversity.
Recommended Templates to Create a Research Presentation
1. Research Project Presentation PowerPoint Template
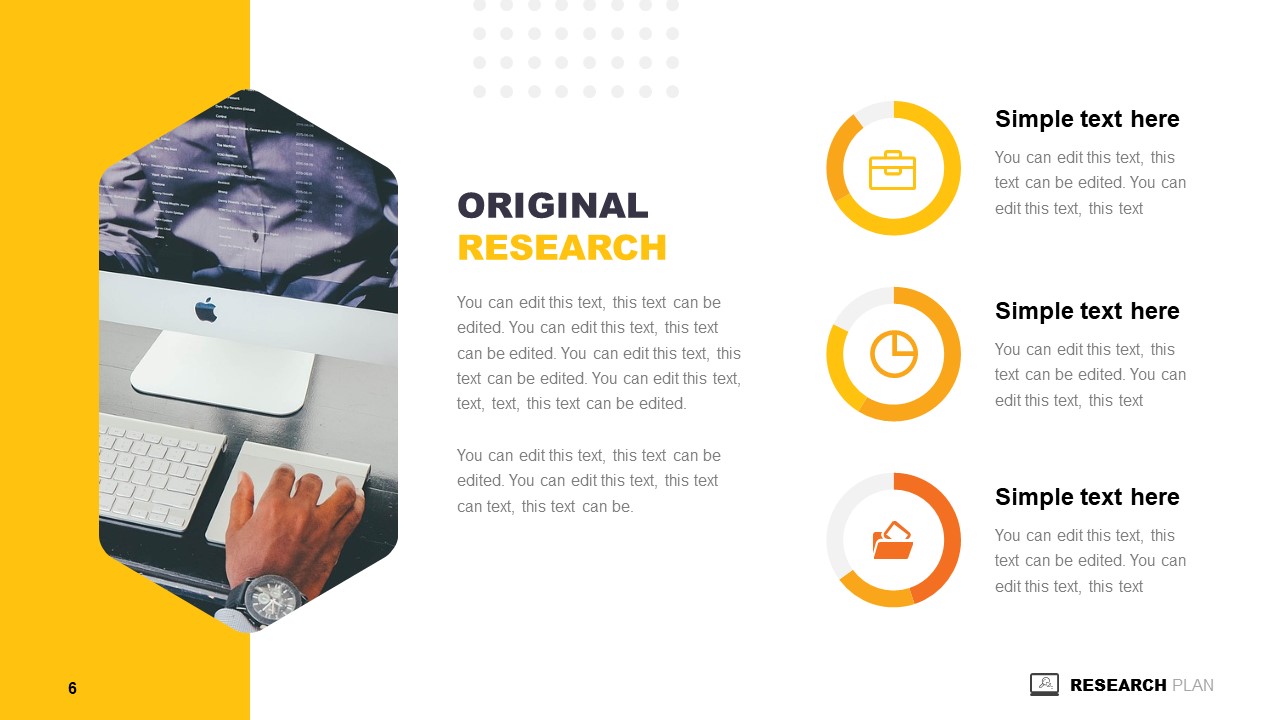
A slide deck containing 18 different slides intended to take off the weight of how to make a research presentation. With tons of visual aids, presenters can reference existing research on similar projects to this one – or link another research presentation example – provide an accurate data analysis, disclose the methodology used, and much more.
2. Research Presentation Scientific Method Diagram PowerPoint Template
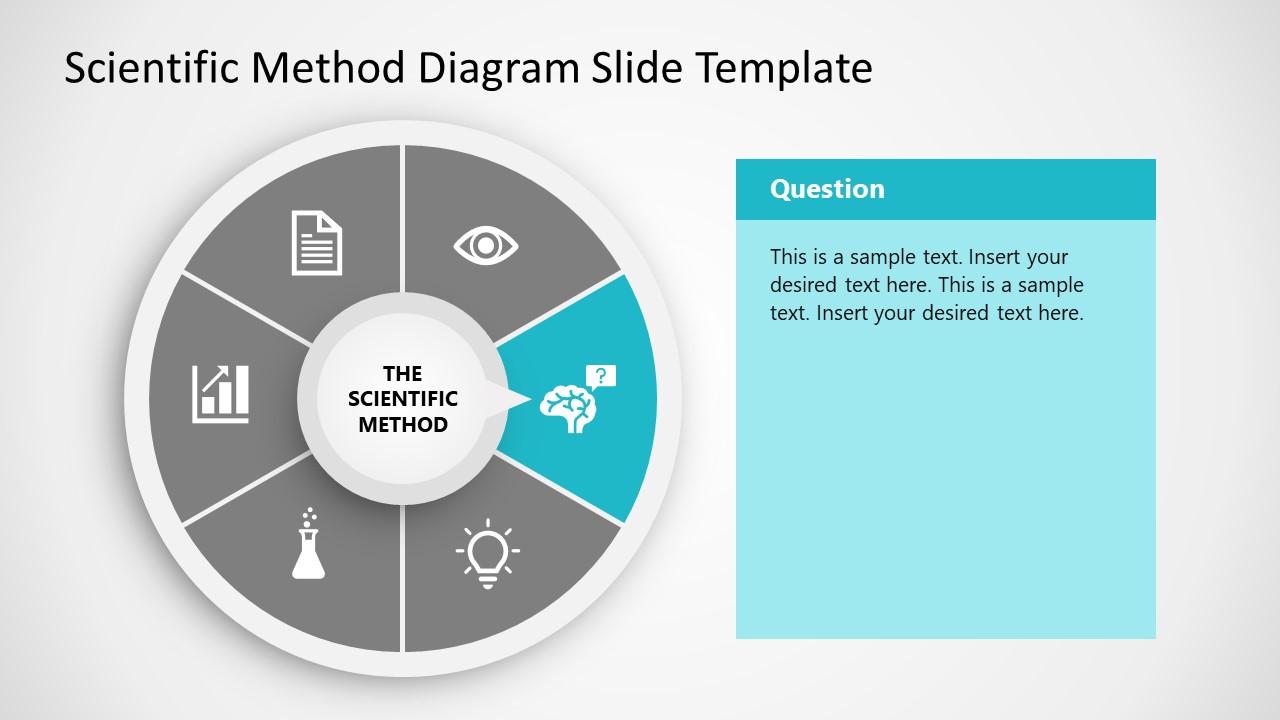
Whenever you intend to raise questions, expose the methodology you used for your research, or even suggest a scientific method approach for future analysis, this circular wheel diagram is a perfect fit for any presentation study.
Customize all of its elements to suit the demands of your presentation in just minutes.
3. Thesis Research Presentation PowerPoint Template
If your research presentation project belongs to academia, then this is the slide deck to pair that presentation. With a formal aesthetic and minimalistic style, this research presentation template focuses only on exposing your information as clearly as possible.
Use its included bar charts and graphs to introduce data, change the background of each slide to suit the topic of your presentation, and customize each of its elements to meet the requirements of your project with ease.
4. Animated Research Cards PowerPoint Template
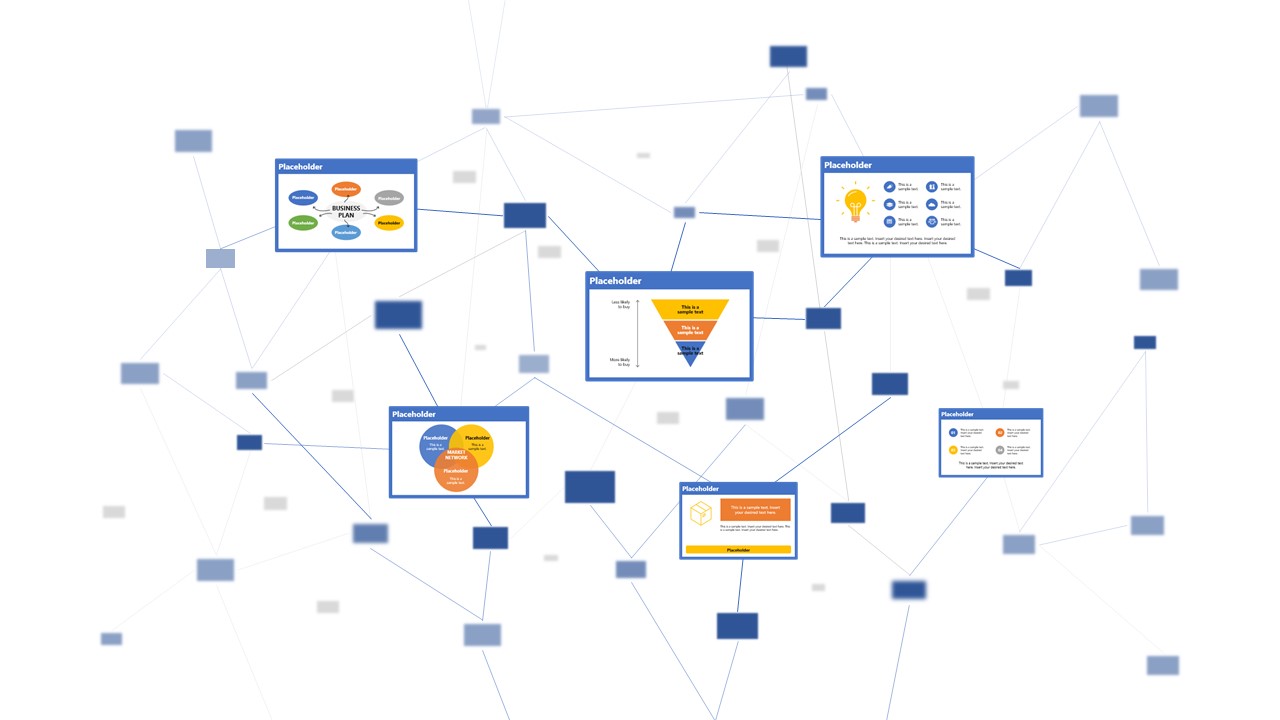
Visualize ideas and their connection points with the help of this research card template for PowerPoint. This slide deck, for example, can help speakers talk about alternative concepts to what they are currently managing and its possible outcomes, among different other usages this versatile PPT template has. Zoom Animation effects make a smooth transition between cards (or ideas).
5. Research Presentation Slide Deck for PowerPoint
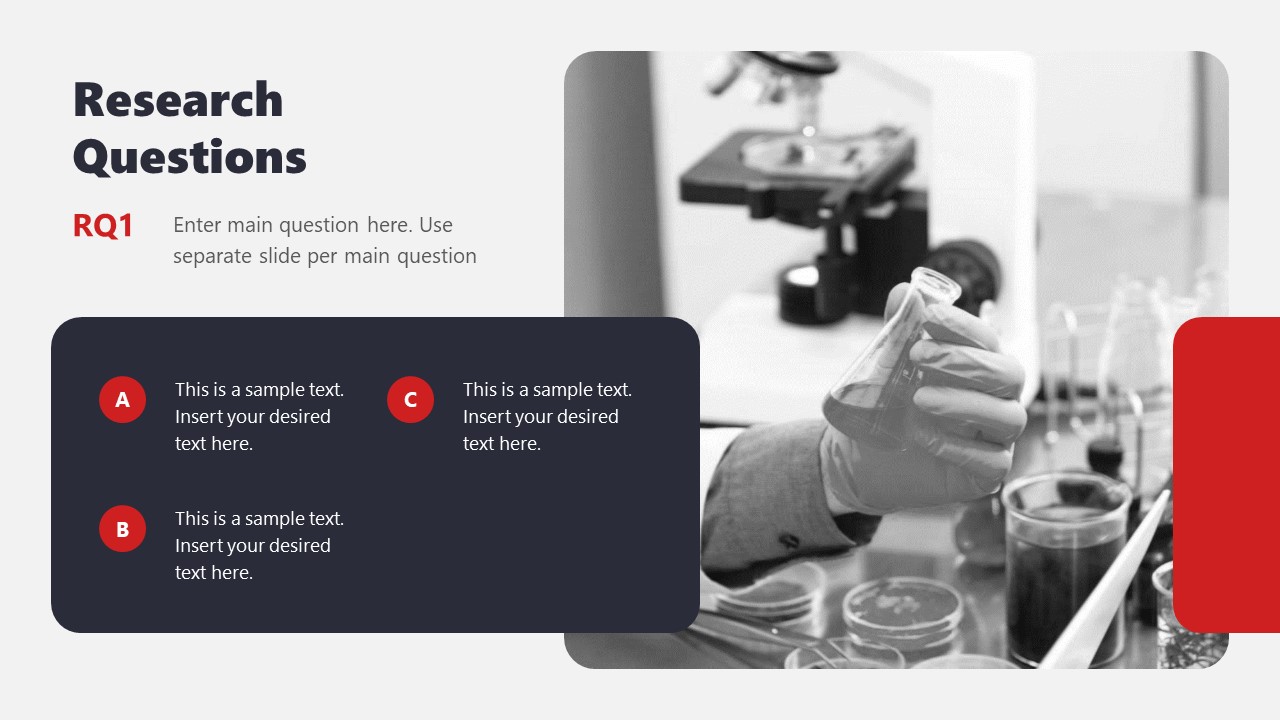
With a distinctive professional style, this research presentation PPT template helps business professionals and academics alike to introduce the findings of their work to team members or investors.
By accessing this template, you get the following slides:
- Introduction
- Problem Statement
- Research Questions
- Conceptual Research Framework (Concepts, Theories, Actors, & Constructs)
- Concepts
- Theories
- Actors
- Constructs
- Study design and methods
- Population & Sampling
- Data Collection
- Data Analysis
- Citations
Check it out today and craft a powerful research presentation out of it!
Conclusion
A successful research presentation in business is not just about presenting data; it’s about persuasion to take meaningful action. It’s the bridge that connects your research efforts to the strategic initiatives of your organization. To embark on this journey successfully, planning your presentation thoroughly is paramount, from designing your PowerPoint to the delivery.
Take a look and get inspiration from the sample research presentation slides above, put our tips to heart, and transform your research findings into a compelling call to action.