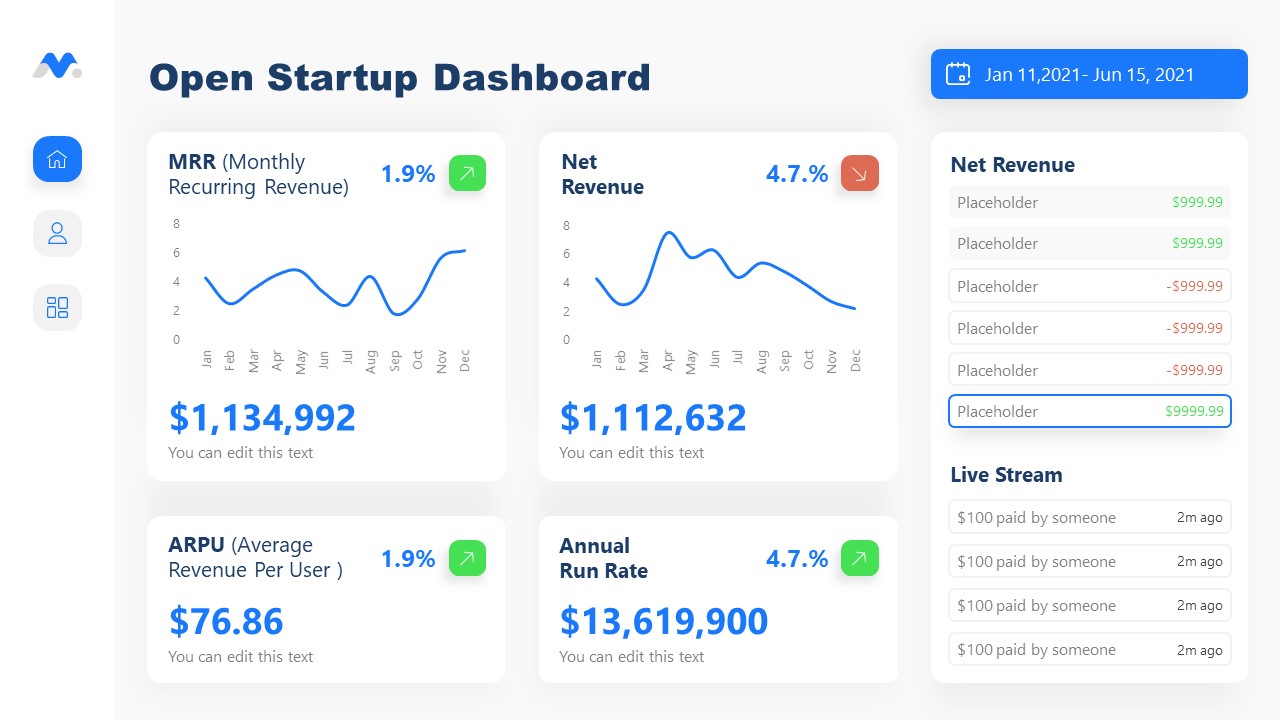
Open Startup Dashboard PowerPoint Template
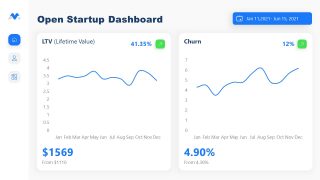
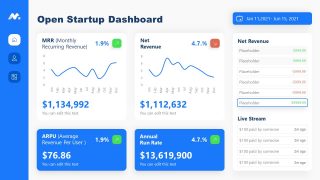
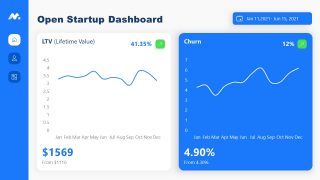
The Open Startup Dashboard PowerPoint Template is a dashboard design presentation template with data-driven charts for preparing presentations for Open Startups. There are two sets of layouts with blue and white PowerPoint themes. Each of these sets contains graph charts for MRR, net revenue, LTV, and churn over the period of one year. The additional components of dashboard templates are useful for providing financial data about startup businesses. These include ARUP, Annual Run Rate, net revenue, and live stream. The template of Open Startup provides a visual aid to understand trends and performance KPIs using clipart icons.
Open Startup Dashboard PowerPoint Template is useful for reporting presentations. Businesses use these templates to share their growth metrics with the public. This revenue dashboard can be customized for customer analysis model and marketing experiments. The data-driven line charts enable users to change make changes in data values that reflect that graph. Click the filter icon on the chart and use the select data option to change values or formulas on the spreadsheet.
Open Startup is a term used to define transparency and openness trends set up by startup companies who make their metrics open to the public. The startup companies began to share statistics, revenue, and growth stories in public. There are several platforms dedicated to providing metrics shared by open startups. These statistic reports are updated regularly, enabling investors to make better financial decisions. The open startup also benefits the company by building community by sharing a success story. The reports of finances, revenue, and growth KPIs inspire and builds trust.
Open Startup dashboard in PowerPoint template centralizes the monitoring of all KPIs during business presentations. The MRR or Monthly Recurring Revenue provides an average of monthly predictable revenue. The net revenue chart in PowerPoint demonstrates the net income after taking the expenses. Use an LTV graph to describe the total worth of a business generate by the lifespan of customer. The churn rate template gives a quick overview of the steady-state level of the business.
For more information check our articles about how to make a presentation graph, data presentations and chart vs. graph.


You must be logged in to download this file.
DOWNLOAD- Category
- Business PowerPoint Templates
- Rating


 Loading...
- Size
- 16x9
- Item ID
- 20980-01
- Colors
Subscribe today and get immediate
access to download our PowerPoint templates.