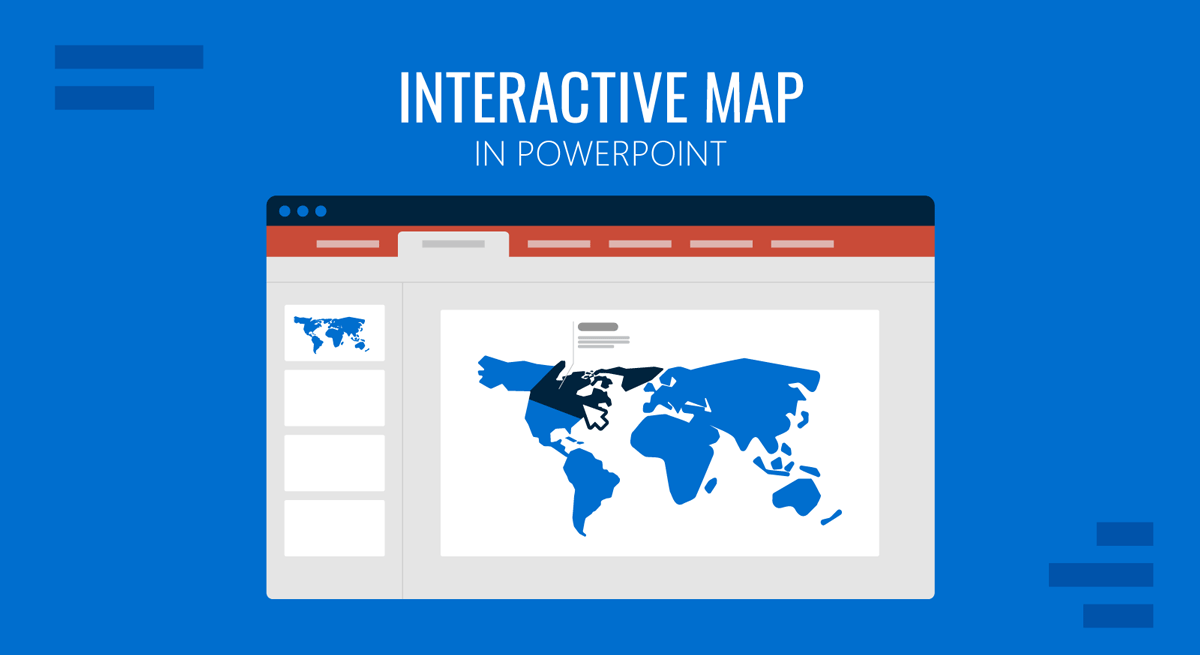
Maps can make presentations more engaging by helping audiences visualize geographic information, locations, and regional data. However, static maps often limit interaction and make it harder to guide viewers through detailed information. Learning how to create an interactive map presentation in PowerPoint can help you create a more engaging slide deck. In this guide, we will provide an overview of how to make an interactive PPT map using current versions of PowerPoint, including Microsoft 365 and PowerPoint 2021. We’ll use the World Map and the map of Brazil as examples and focus on methods that remain functional and practical in modern versions of PowerPoint.
What is an Interactive Map in PowerPoint
An interactive map presentation allows users to click regions, icons, or buttons to navigate between slides or reveal additional information. Instead of showing everything at once, the map becomes a navigation tool. Interactive maps are commonly used not only for corporate presentations but also for tourism guides, educational presentations, sales territory reports, logistics planning, governance presentations, and regional analysis.
Interactive maps improve presentations by making them more engaging and easier to navigate. They help you present information progressively. You can create non-linear presentations, improve audience engagement, highlight regions individually, and simplify complex geographic information. For example, instead of placing all information about a country on one slide, you can click a city on the map and jump to a dedicated slide with details.
How to Create an Interactive Map in PowerPoint
To create an interactive map presentation, you will need Microsoft PowerPoint (Microsoft 365 or PowerPoint 2021 recommended), a map image or editable map template, separate slides for regions or locations, and hyperlinks or action triggers. Below are different methods you can use to create interactive maps in PowerPoint using the tools mentioned above.
Method 1: Create an Interactive Map with PowerPoint Chart Tools
PowerPoint Chart Tools provide a built-in map option to generate a map you can make interactive. This feature can be useful when you want to present regional- or country-level data without designing a map from scratch. While PowerPoint map charts are primarily designed for data visualization, you can adapt them to create a simple interactive map presentation.
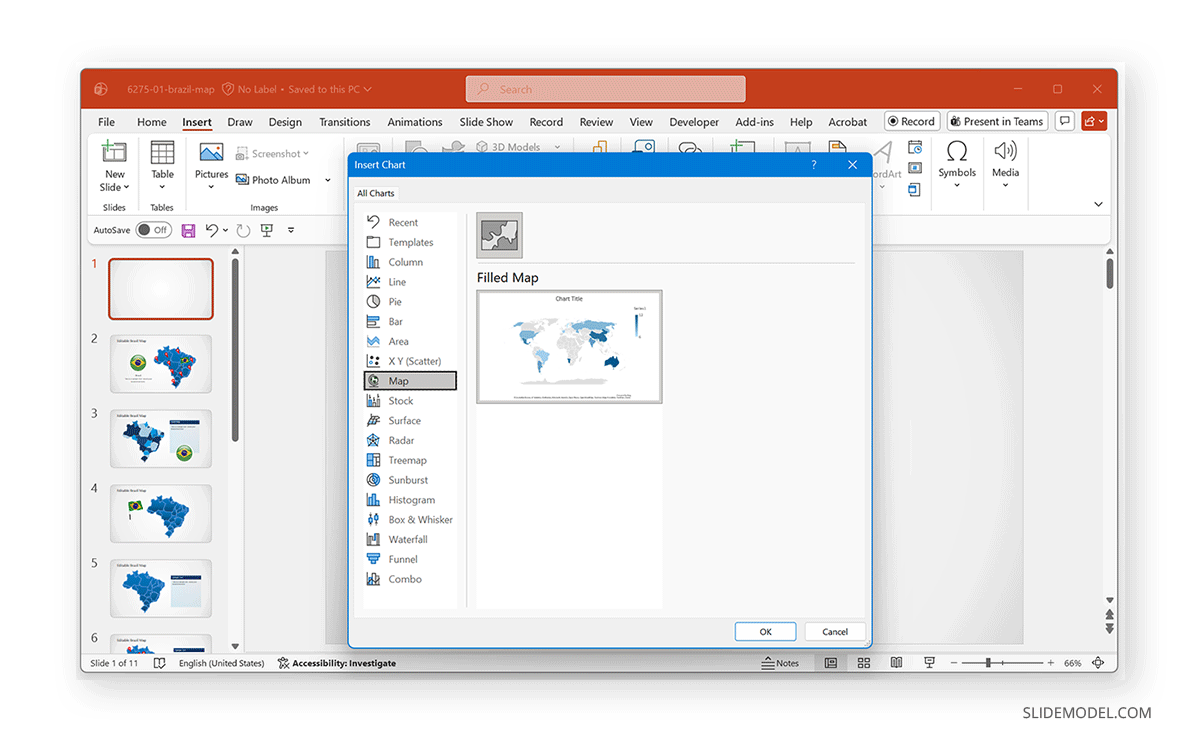
Step 1: Go to Insert -> Chart and select Maps from the chart categories. Choose the standard Filled Map option to insert a map chart into your slide. PowerPoint will open an Excel data window where you can enter geographic information linked to the map. This option enables Bing-powered map generation in PowerPoint slides.
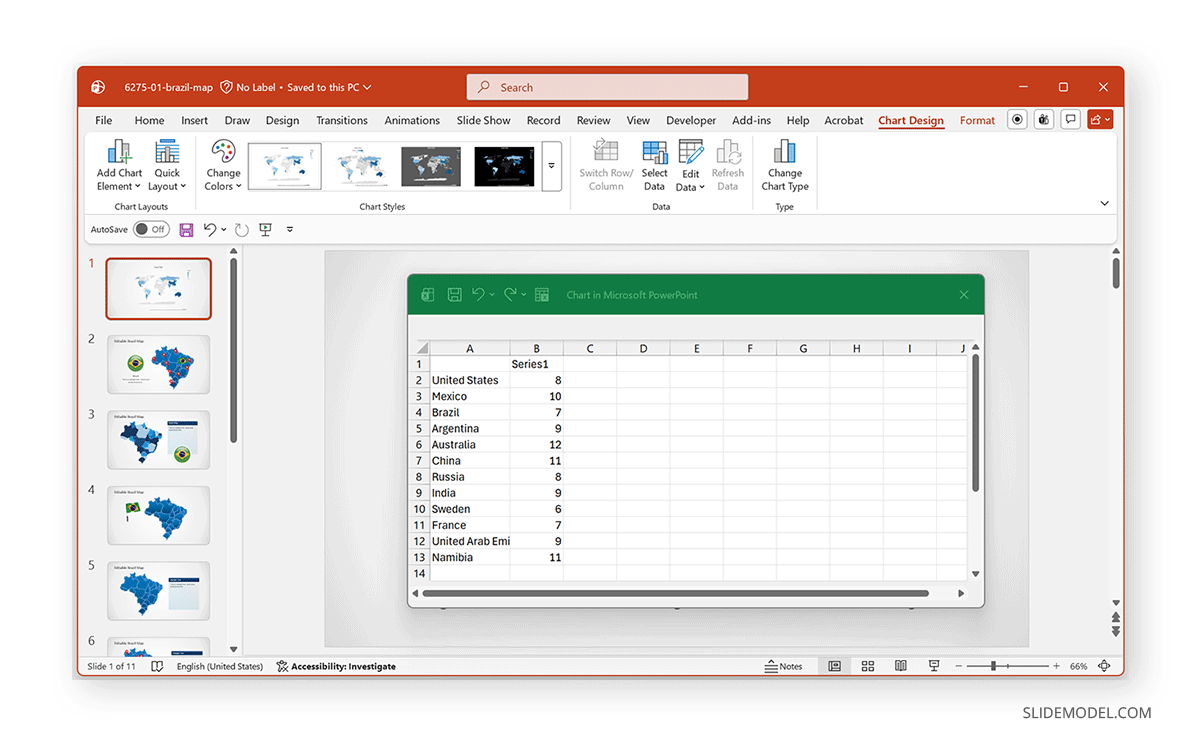
Step 2: In the Excel sheet, enter the regions or locations you want to display. You can also include associated values such as sales figures, population data, or performance metrics. Once you enter the data, PowerPoint automatically generates a map visualization based on the regions provided. For example, we added different countries to create a world map and highlight selected countries.
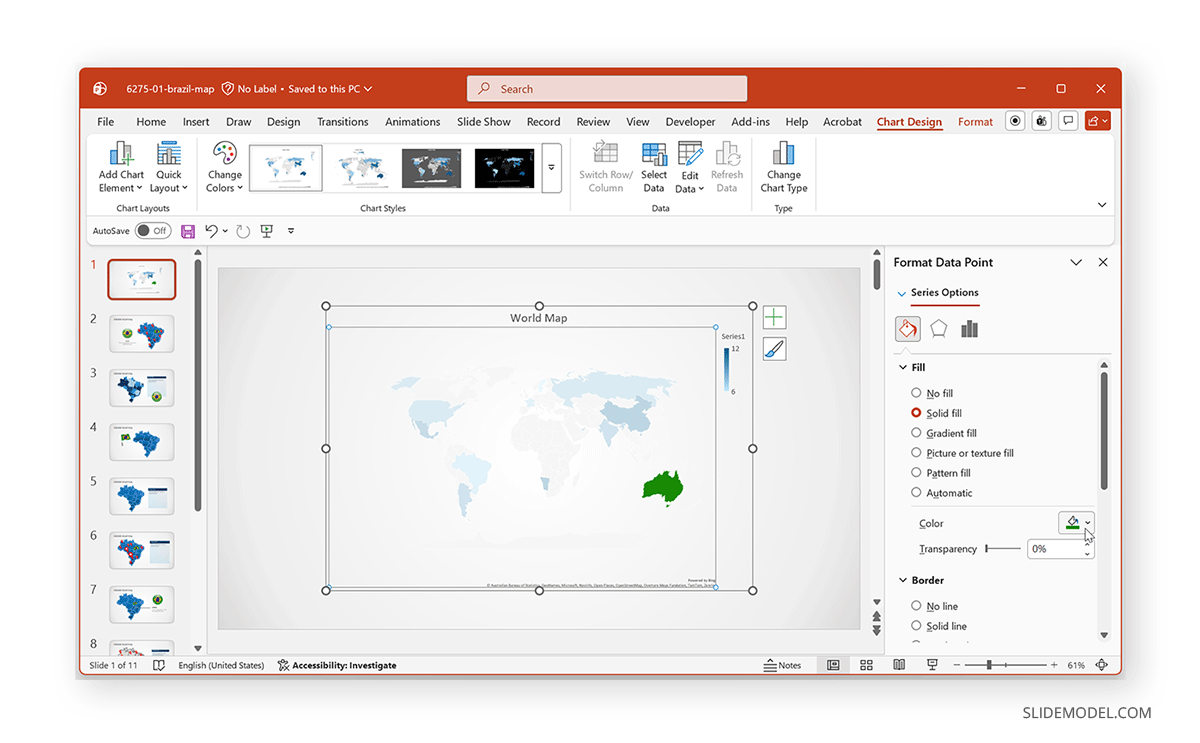
Step 3: After the map appears, use the Chart Design and Format tabs to customize colors, labels, and styles. You can change region colors, add data labels, modify borders and outlines, and adjust chart size and layout. This helps make important regions easier to identify during the presentation. After the map appears, use the Chart Design and Format tabs to customize colors, labels, borders, outlines, and chart layout. You can also resize the map and apply stronger highlight colors to specific regions to make them more visually prominent during the presentation.
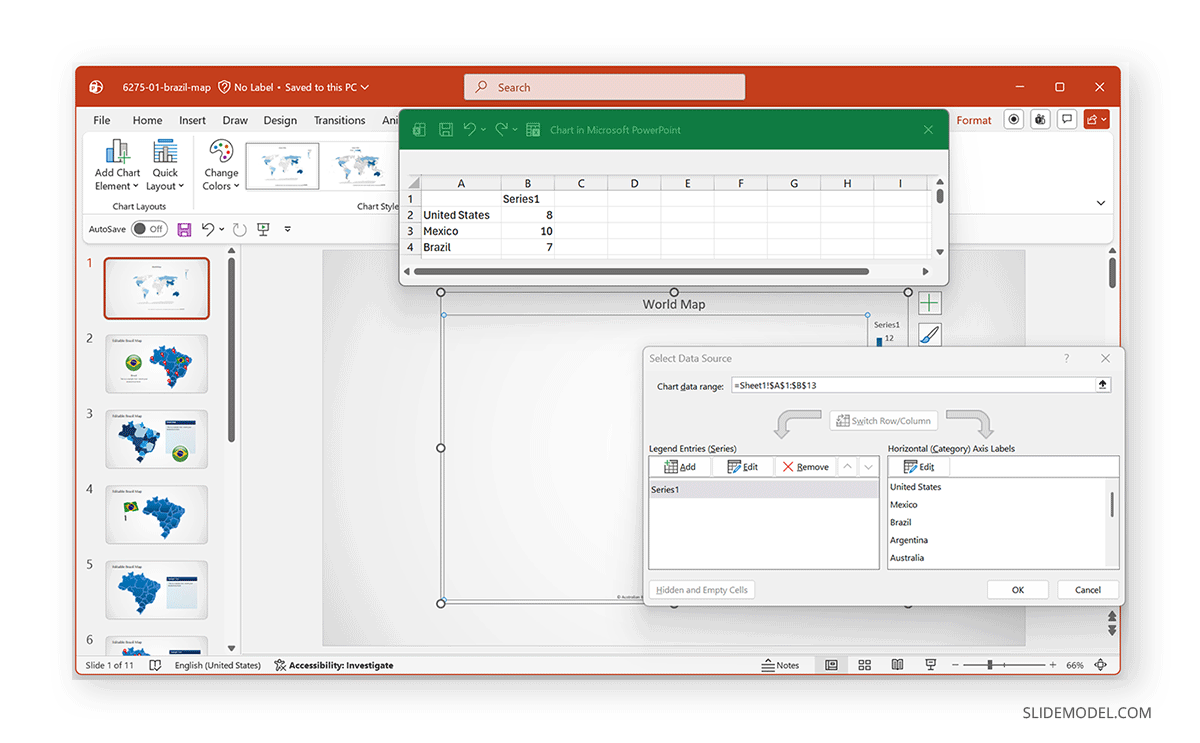
Step 4: By default, PowerPoint includes a limited number of rows in the Excel sheet. If you need additional regions or cities, you can manually expand the data selection. To do this, click the map chart and go to Chart Design -> Select Data and adjust the cell range in the formula field to include additional rows.
Step 5: Although map charts are not fully interactive by default, you can combine them with PowerPoint features to simulate interactivity. For example, you can add transparent shapes over regions, link shapes to detailed slides using Insert -> Link, and apply animations or triggers to highlight selected areas. For instance, placing a transparent, clickable shape over an area can let users jump to a dedicated slide with additional information about that location.
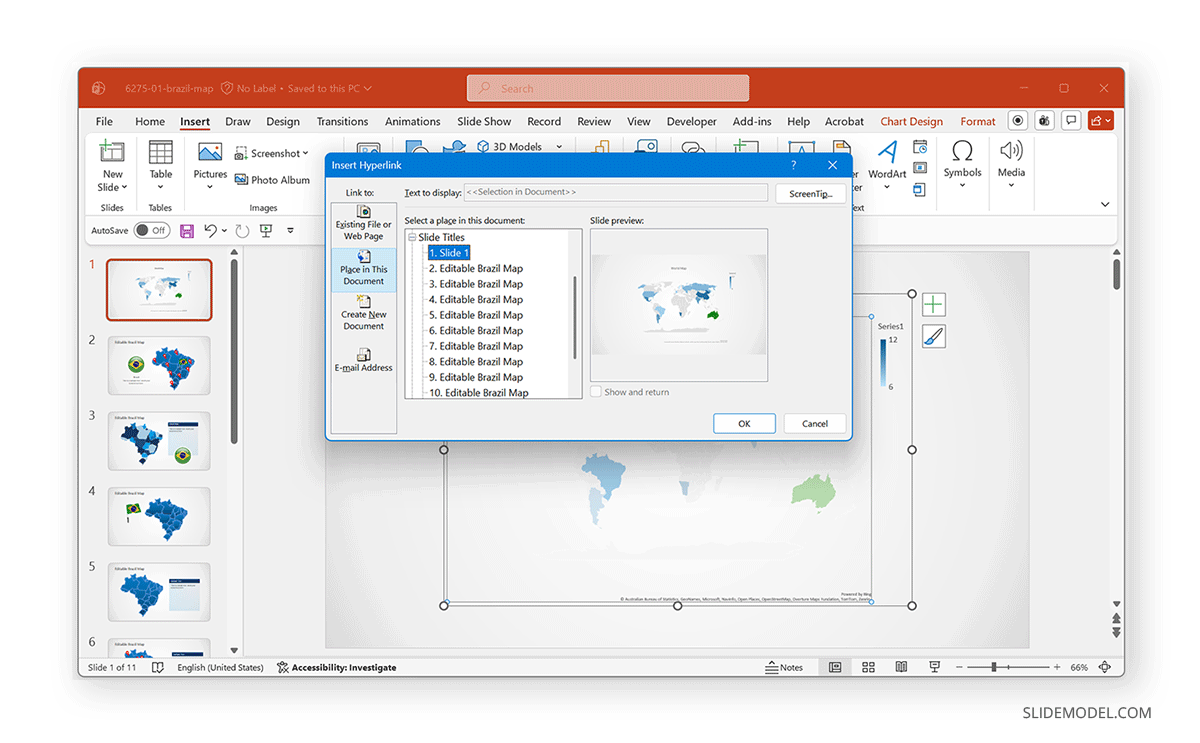
Method 2: Create an Interactive Map Using Editable Shapes and Map Templates
While chart tools can generate Bing-powered maps in PowerPoint, it can be hard to create accurate maps for cities and regions. As an alternative, you can use editable templates with images or shapes for creating more customizable interactive maps. As an example, we will use the Editable Brazil Map PowerPoint Template to show how to use editable shape-based maps for making interactive map slides.
Step 1: Open the map template and select the areas you want to highlight. Add icons, images, and text as needed.
Step 2: Highlight key areas by selecting a different fill color. Add effects such as Shadow or Glow as required.
Step 3: Select areas on the map to link to different slides. You can also create copies of the same map slide, each highlighting a different area, and connect the slides for interactivity. To connect slides, select the map shape and go to Insert -> Link.
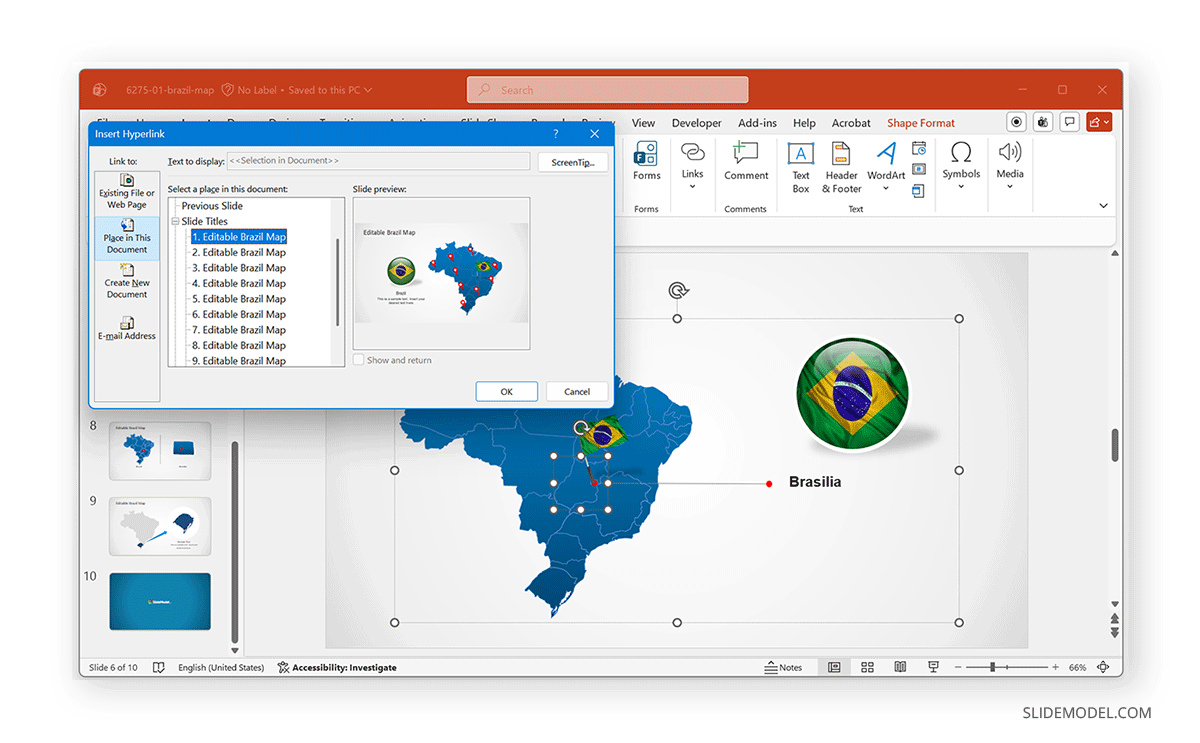
Method 3: Create an Interactive Map with a Map Image
For specific maps of certain areas, you can also use images to design an interactive map in PowerPoint.
Step 1: Add a map image to your presentation. Image files such as SVG maps work especially well because PowerPoint keeps them editable. Alternatively, you can use a PNG or JPG image and turn icons or other objects on slides into linked elements for interactivity. To get started, insert the map image via Insert -> Pictures.
Step 2: Right-click the image, choose Convert to Shape (SVG maps). This allows you to select individual regions separately. Alternatively, you can add icons and text to link between slides on the static image.
Step 3: Select the region and change its formatting by applying a different fill color and outline, and add glow or shadow effects as needed. This helps users identify the clickable area.
Step 4: Select a region on the map and go to Insert -> Link to make the map slide interactive. You can connect slides to make map elements clickable.
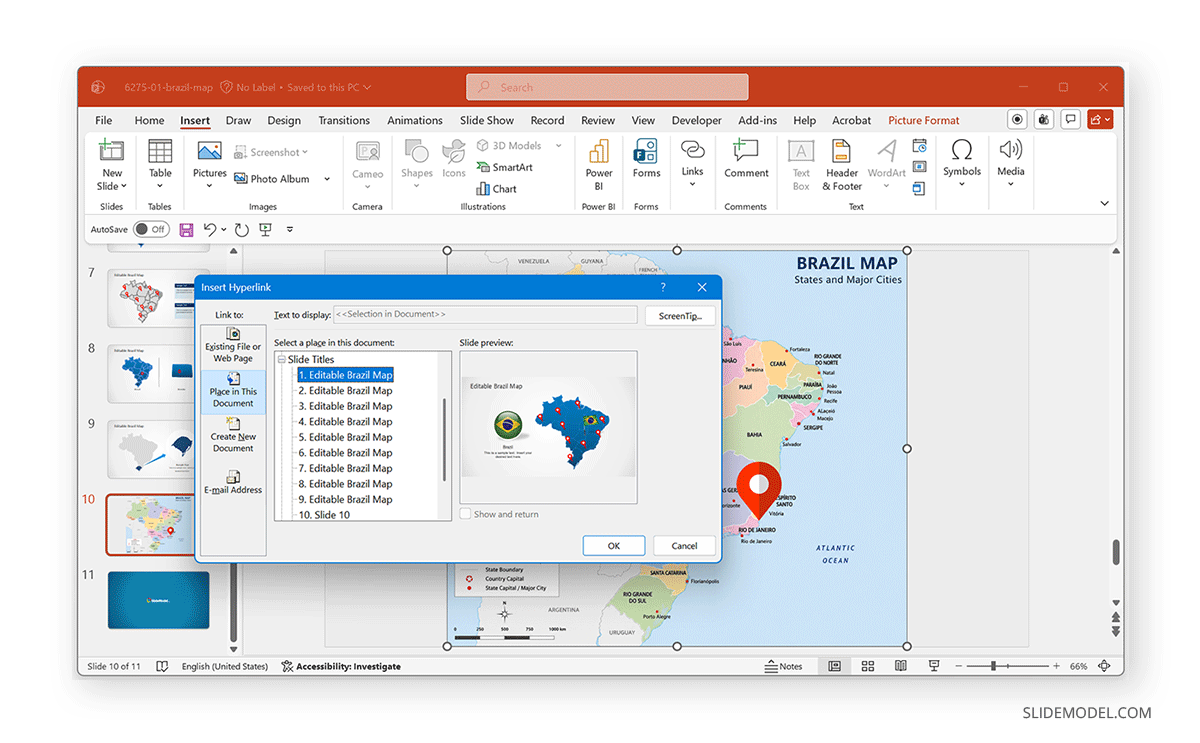
Creating Interactive Navigation and Click Effects in PowerPoint Maps
An interactive map presentation becomes much more effective when users can navigate smoothly between slides and visually identify clickable regions. In PowerPoint, you can achieve this by combining hyperlinks, navigation buttons, animations, and triggers. Now that we have covered three ways to create interactive maps, you can further refine your slides with buttons, triggers, animations, and PowerPoint Zoom.
Create a Zoom-Based Interactive Map
PowerPoint’s Zoom feature is another handy option. You can insert the Zoom navigation by going to Insert -> Zoom -> Slide Zoom. Select the destination slides and place Zoom thumbnails over corresponding map regions. You can crop or resize them for a cleaner look.
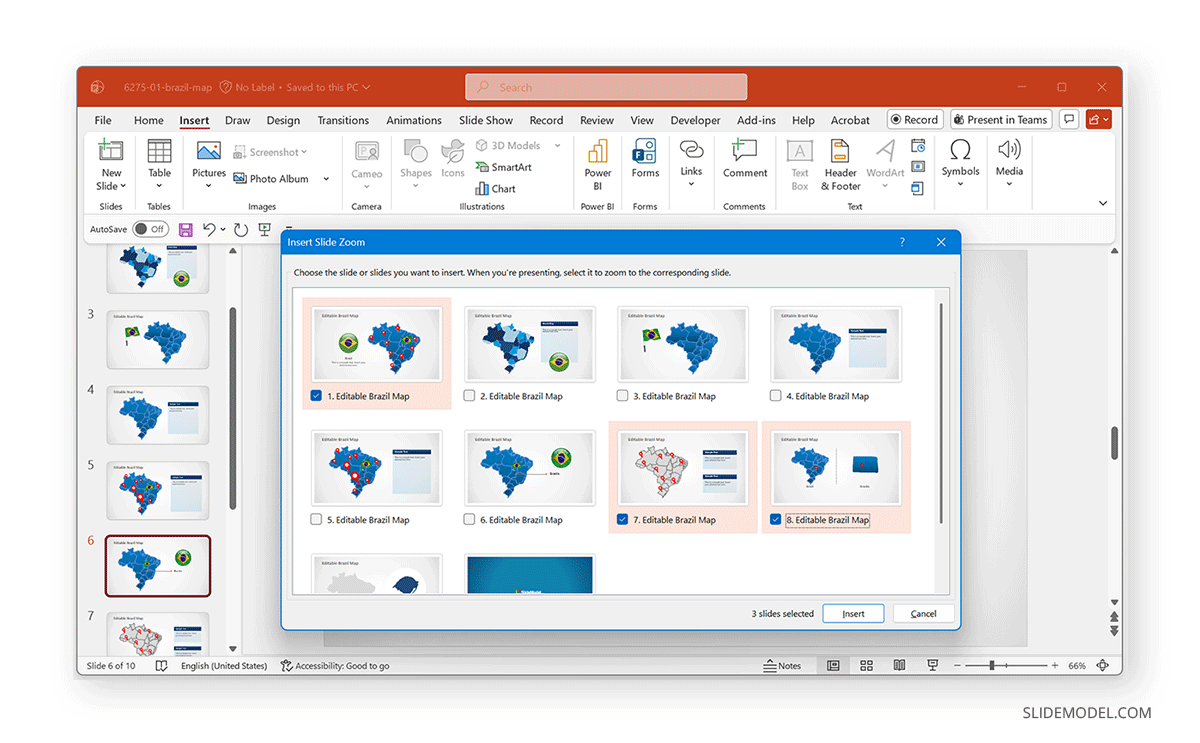
Adding Navigation Buttons for Better Slide Flow
To help users move through your presentation more easily, you can add navigation buttons to each regional slide. For example, after linking Rio de Janeiro to a dedicated detail slide, you can include a “Home” or “Back to Map” button so viewers can quickly return to the main map.
To do this, go to Insert -> Shapes and add a button, icon, or custom shape to the slide. Then select the shape and use Insert -> Link to connect it back to the main map slide. This creates a more structured and user-friendly navigation experience, especially in non-linear presentations where viewers may jump between locations.
Simulating Interactive Click Effects with Animations
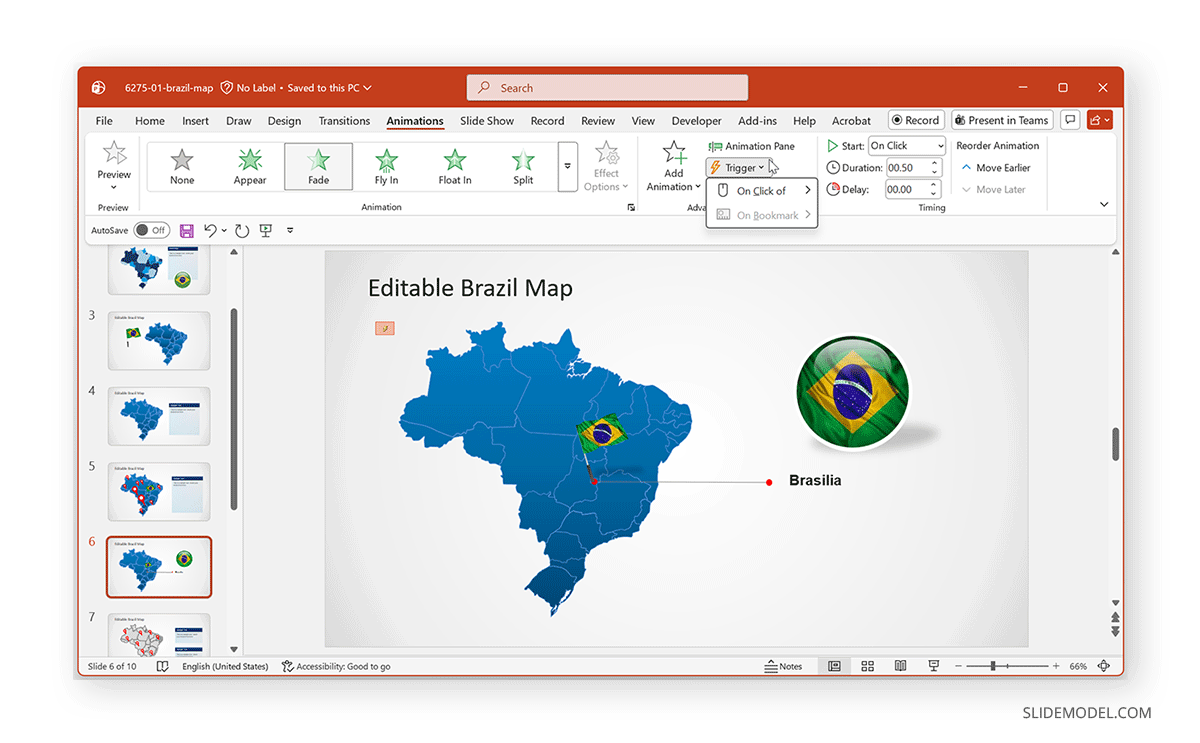
While PowerPoint does not support true hover effects like websites, current versions let you simulate interactive behavior using built-in animation tools. PowerPoint also allows you to create pseudo-interactive effects using PPT animations and triggers. One practical method is to duplicate a map region and place the duplicate directly above the original shape. You can then modify the duplicate by changing its color or transparency, or by adding a glow effect to make it stand out visually.
Next, apply an animation such as Fade, Appear, or Grow/Shrink to the highlighted shape. Using Animations -> Trigger, you can configure the effect to activate when the original region is clicked during the slideshow. This creates the impression of an interactive response when users select part of the map.
Combining Navigation and Animation Features
For a more interactive map presentation, you can combine both methods. For example, a presenter clicks Brasilia on a map of Brazil, highlights the region with an animation, then clicks a second button that opens the dedicated slide, and a navigation button returns the viewer to the main map. This layered approach helps guide users naturally through the presentation while making the map feel more dynamic and interactive. Because these methods rely on built-in PowerPoint features such as hyperlinks, triggers, and animations, they remain compatible with modern versions of PowerPoint, including Microsoft 365 and PowerPoint 2021.
Final Words
An interactive map in PowerPoint can transform a simple presentation into a more engaging and dynamic experience. By combining editable map shapes, hyperlinks, Zoom navigation, and animations, you can create presentations that allow viewers to explore locations interactively.
Even a basic regional presentation can become more organized and visually engaging when you use interactive maps thoughtfully. If you can’t create maps with PowerPoint Chart Tools that drill down to specific areas, you can use an image with marked icons or ready-made PowerPoint map templates to create interactive map slides. By linking required sections on the map, you can quickly create navigation for slides that switch between different parts of the map. This is a great way to present key information using maps and connected slides, engage your audience, and make it easier to break down geographical statistics.