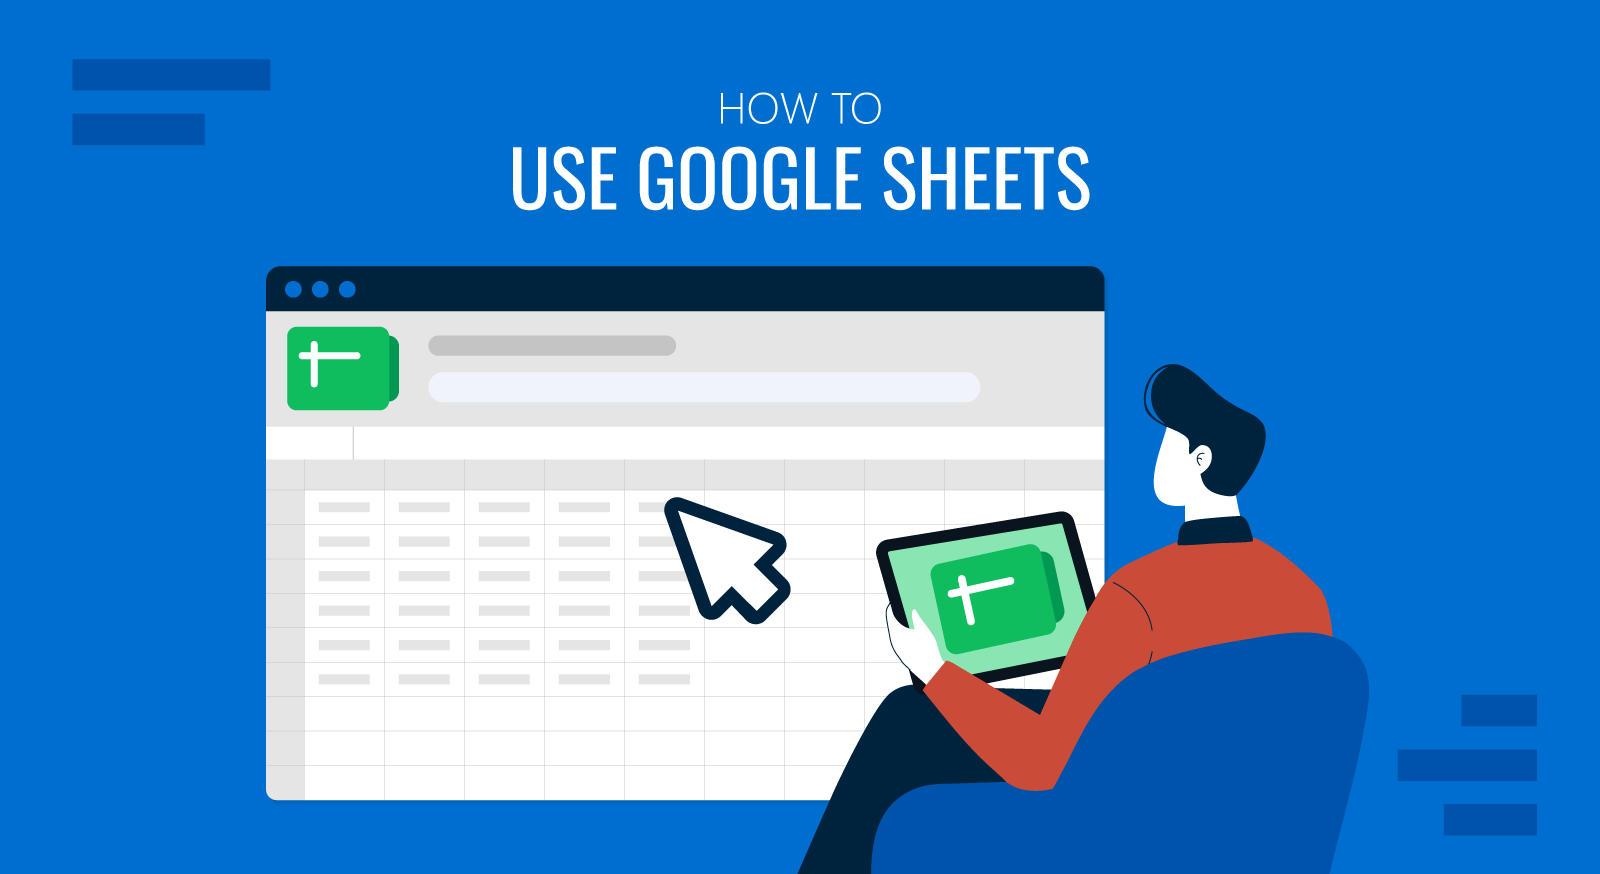
Google Sheets is one of the most commonly used Microsoft Excel alternatives. Google Sheets is available through a web browser and on mobile devices, with offline access also available when configured. In this guide, we will explain how to use Google Sheets from the ground up, starting with creating a spreadsheet and entering data before moving into AI, formulas, collaboration, and data visualization.
What Google Sheets is
Google Sheets is a spreadsheet application designed to organize information, perform calculations, analyze data, and work with collaborators in the same file. It covers many of the everyday tasks people associate with Microsoft Excel, but places stronger emphasis on cloud access and real-time collaboration.
For a business user, that makes Sheets useful for everything from budgets and project trackers to survey data, campaign reporting, inventory lists, and shared planning documents. You can also use it to prepare your data presentations. In Google Sheets, changes are saved automatically, files live in Google Drive, and multiple people can collaborate in the same spreadsheet without passing different versions back and forth.
A Google Sheets file is built around a grid of rows and columns like a Microsoft Excel file. Where a row and column intersect, you get a cell. Each cell has an address based on its column letter and row number, such as A1, B4, or F12.
One column might contain employee names, another could contain monthly sales, and a third could calculate performance against a target. You can also use it for a simple contact list or a much larger dataset with formulas, charts, filters, and multiple sheets.
As Sheets is part of Google Workspace, files can be stored in Google Drive and shared directly with other users. You can also work offline when offline access has been enabled, although the application is primarily designed around a connected, cloud-based workflow.
Users new to data spreadsheets or who prefer a cloud-based workflow can use Google Sheets as a practical alternative to Microsoft Excel.
How to Create a New Spreadsheet in Google Sheets
There is more than one way to create a spreadsheet, and the best method usually depends on where you are starting.
Method 1: Create a Spreadsheet From Google Sheets
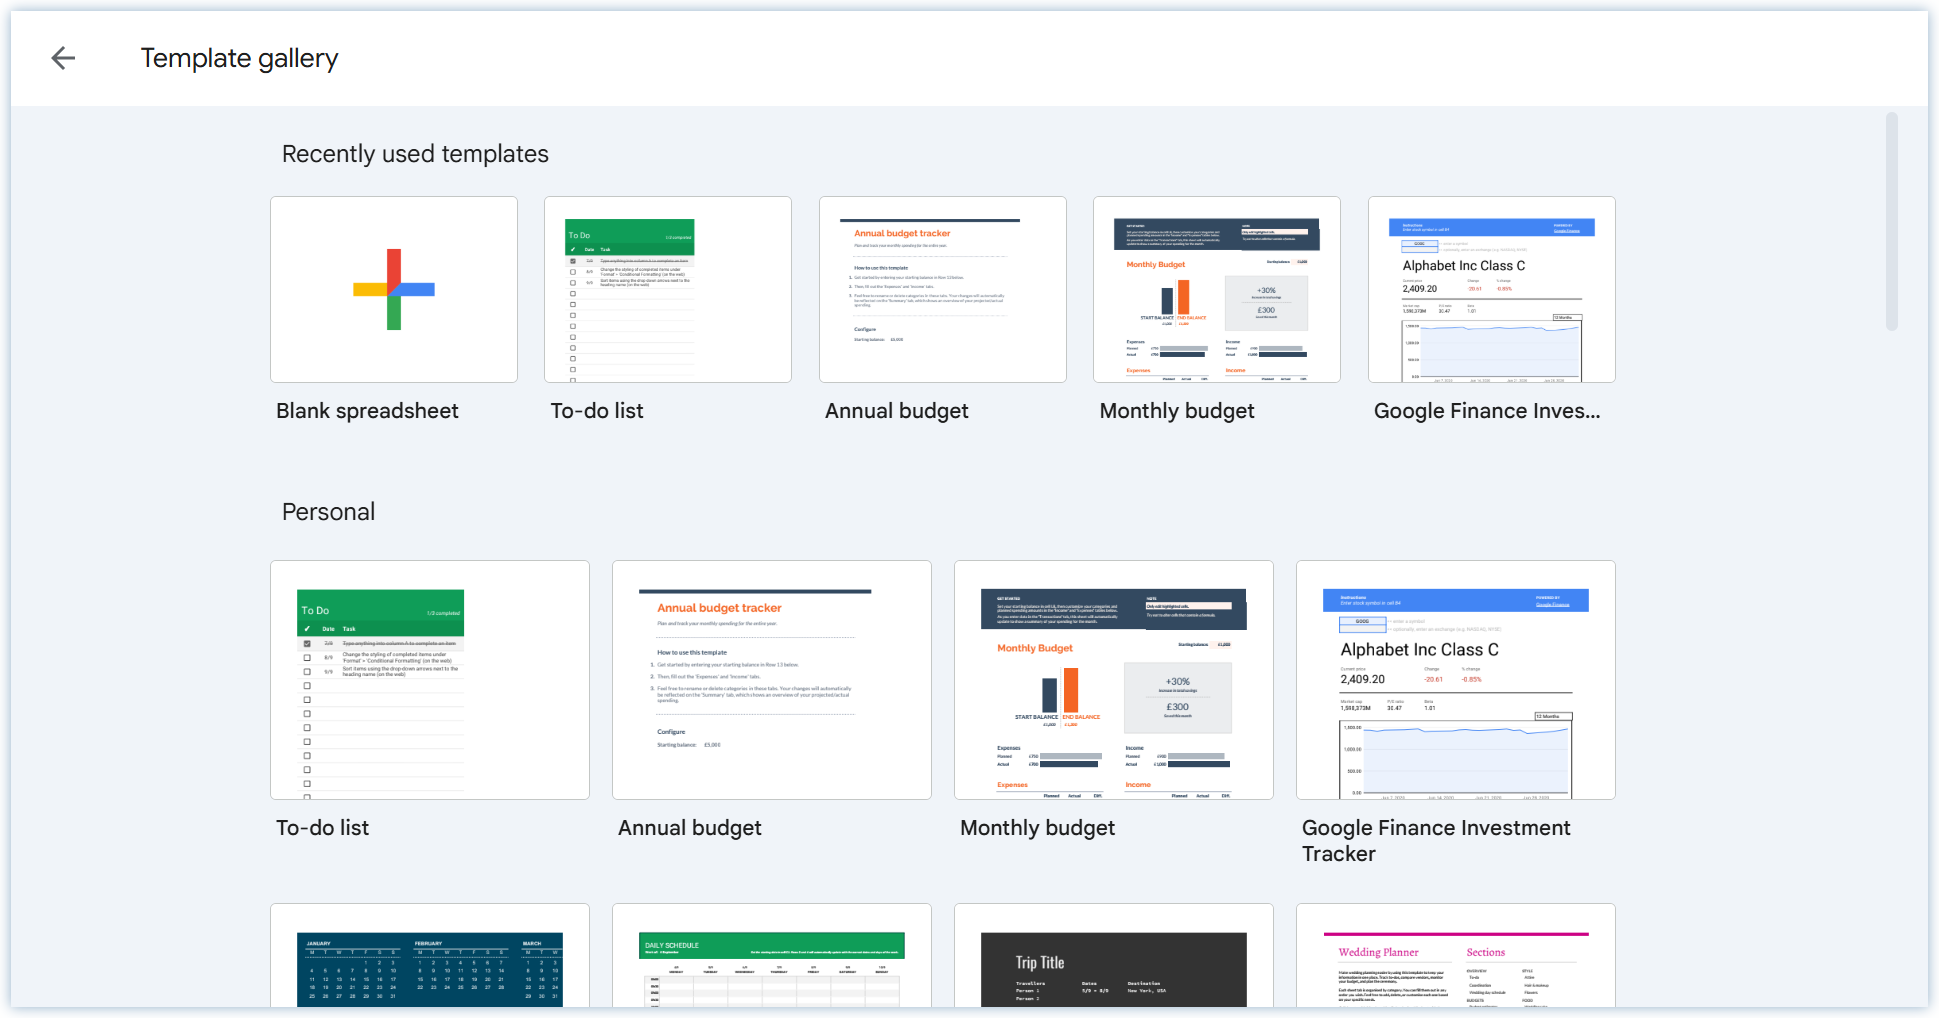
Open Google Sheets and select Blank spreadsheet to start with an empty file. Google also provides templates for common tasks, so you don’t always need to build a budget, schedule, project tracker, or similar document from scratch. Once the spreadsheet opens, give it a useful name. This becomes more important than it sounds once Google Drive starts filling up with files called Untitled spreadsheet.
Method 2: Create a Spreadsheet From Google Drive
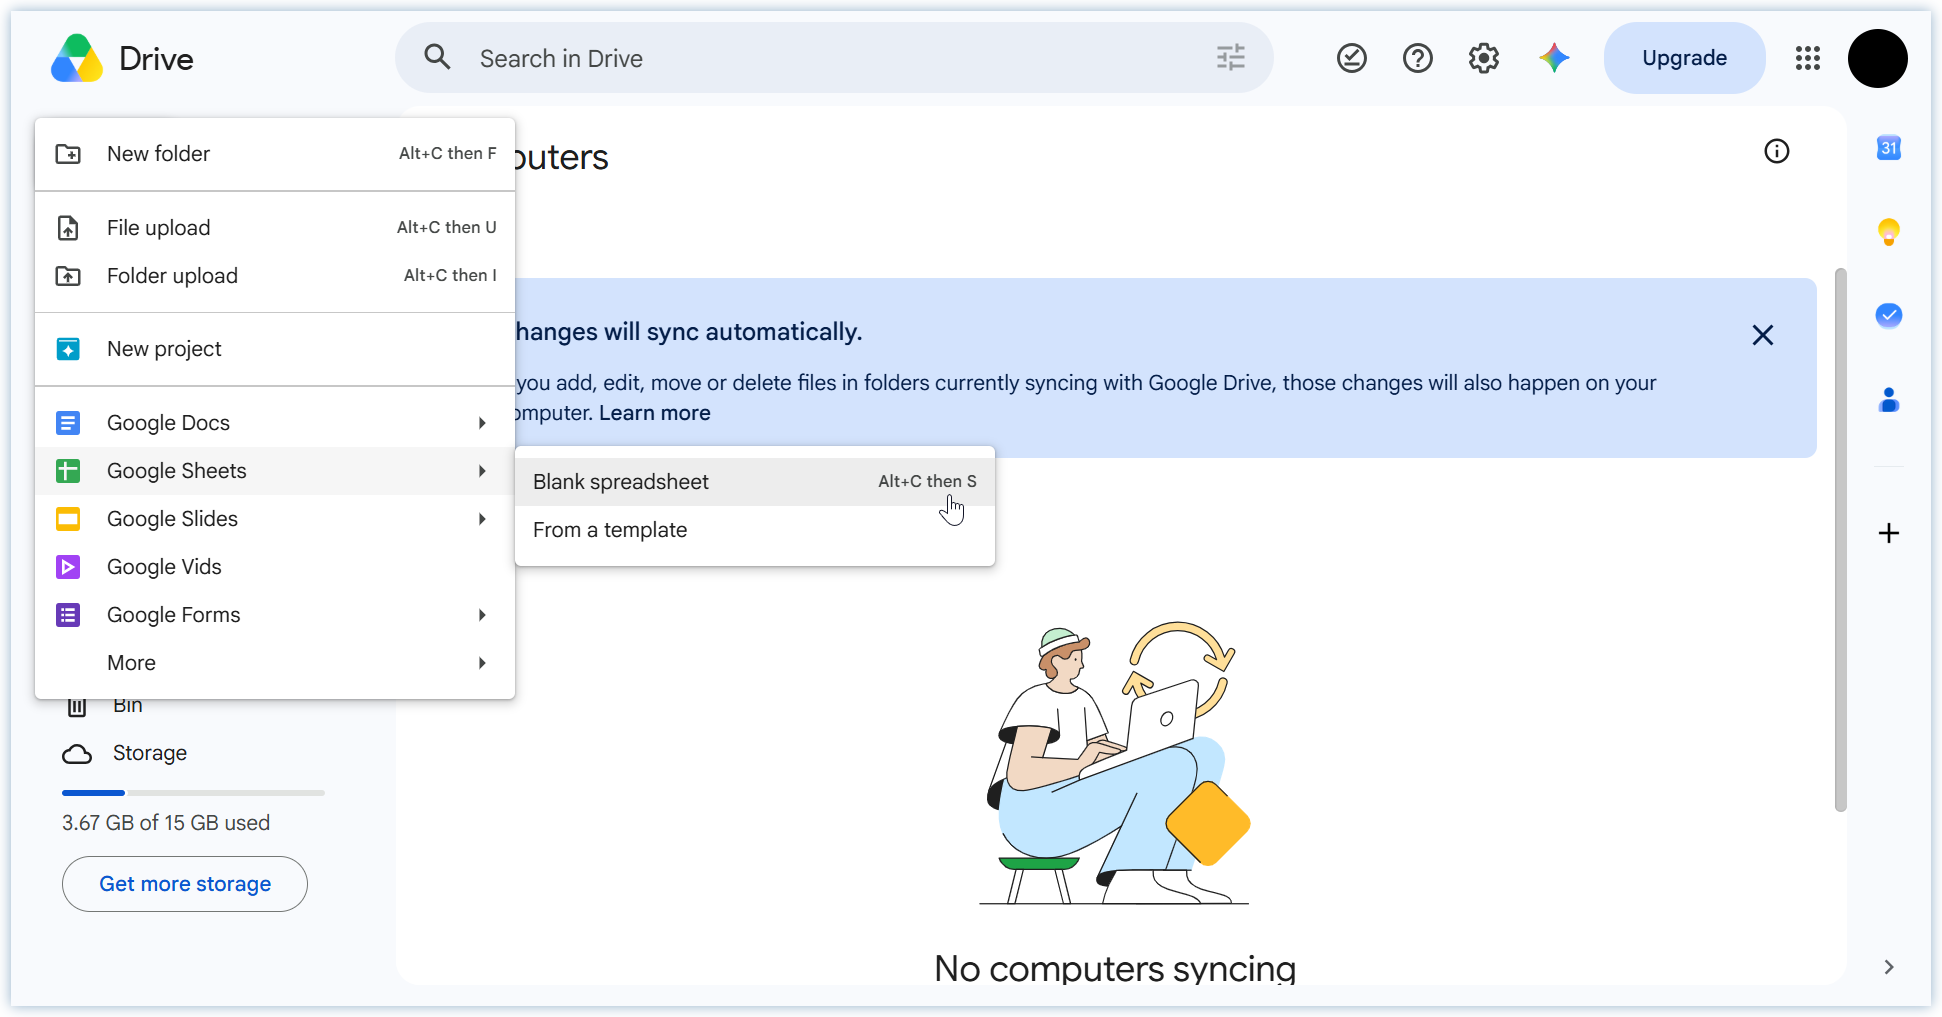
From Google Drive, select New -> Google Sheets. You can create a blank spreadsheet or start from a template. This method is convenient when you are already organizing files in a particular Google Drive folder because the new spreadsheet is created there.
Method 3: Create a New File From an Existing Spreadsheet
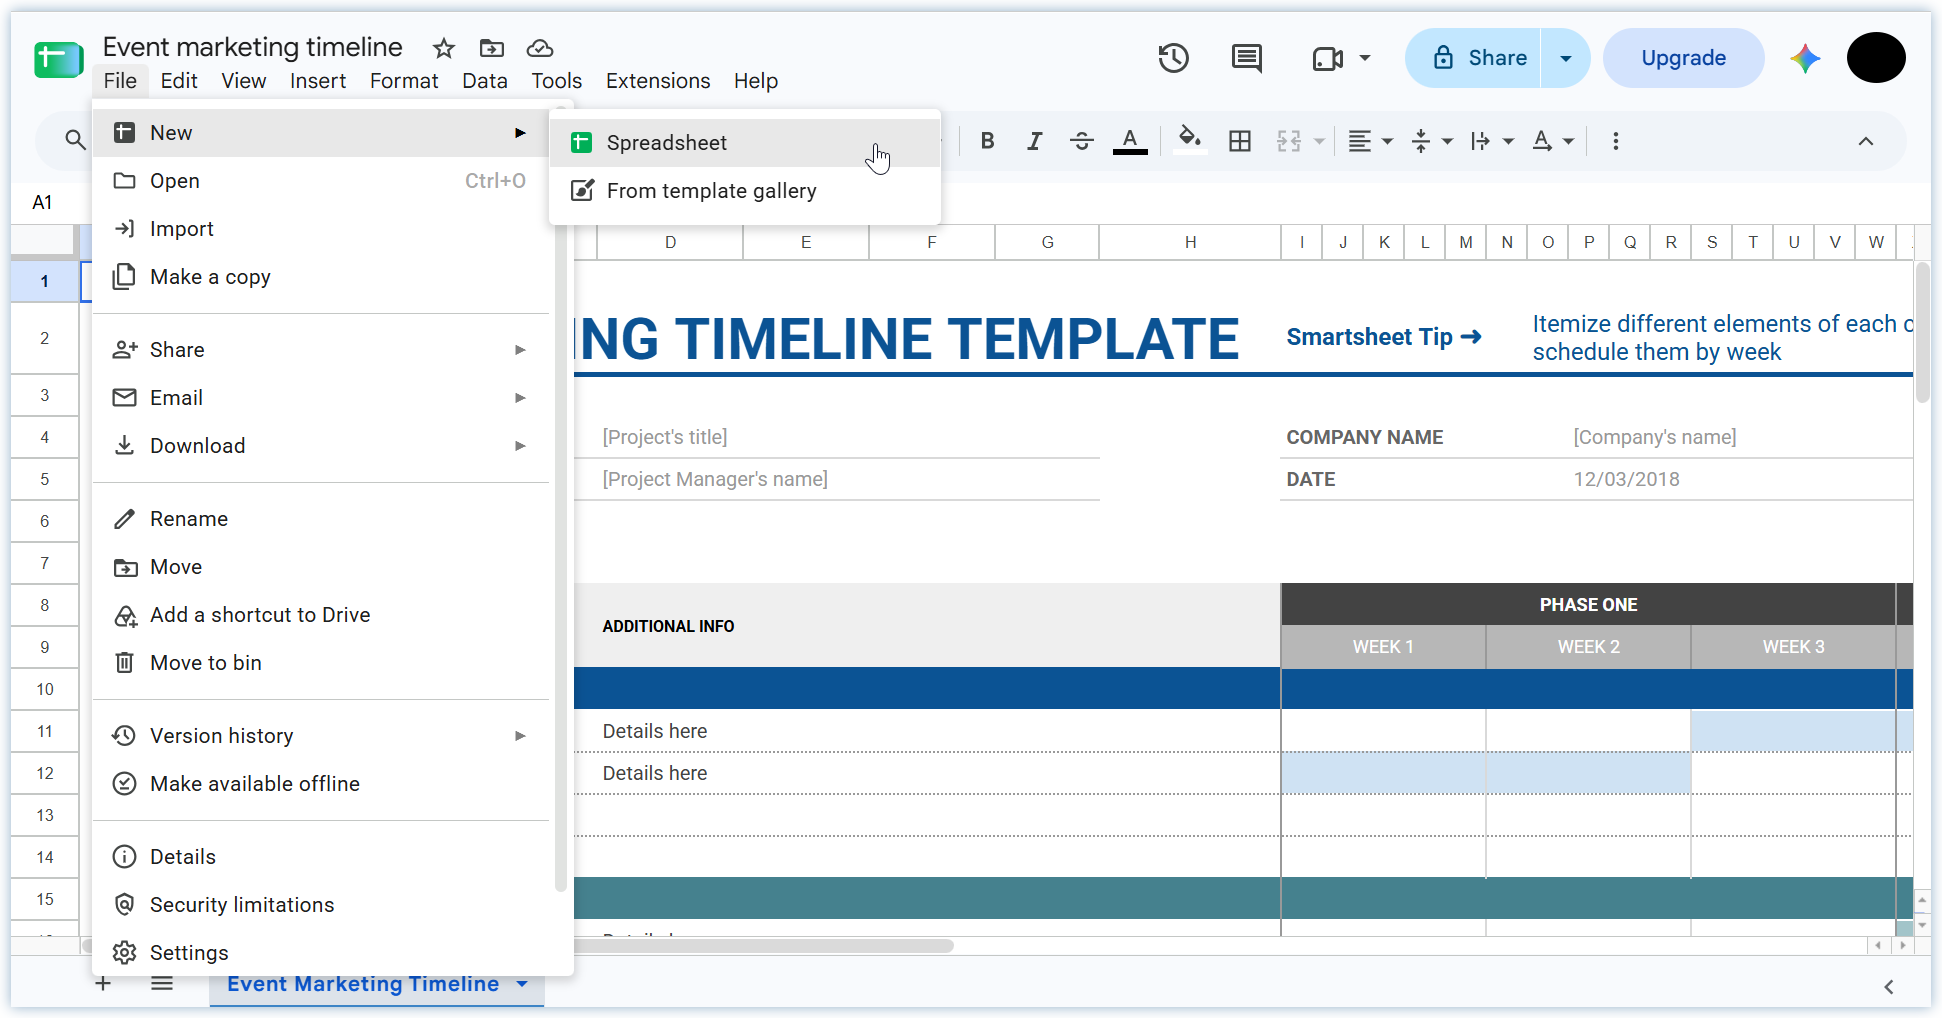
If you are already working in Google Sheets, you can create another spreadsheet from File -> New -> Spreadsheet rather than returning to Google Drive or the Sheets homepage.
Method 4: Create a New Sheet from sheets.new
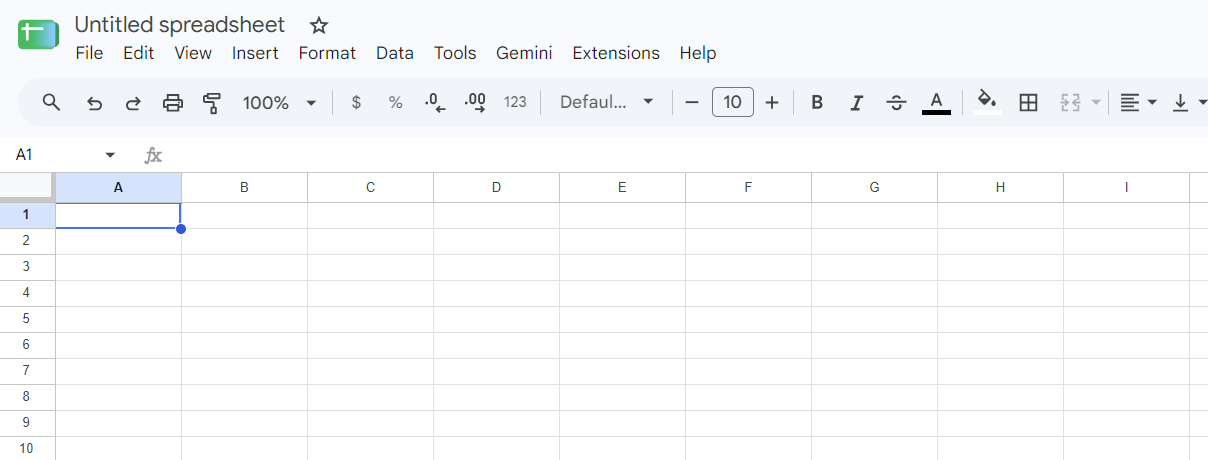
If you want to start a new spreadsheet in Google Sheets, you can just point your browser to https://sheets.new and it will redirect you to a blank sheet. This trick also works for other products offered by Google (try it with slides.new and docs.new).
How to Add Data to a Spreadsheet
Adding data to a Google Sheets spreadsheet is straightforward. Simply select a cell and start typing. The content might be text, a number, a date, a percentage, or a formula. Press Enter when you are finished to move down to the next row, or Tab to move across to the next column.
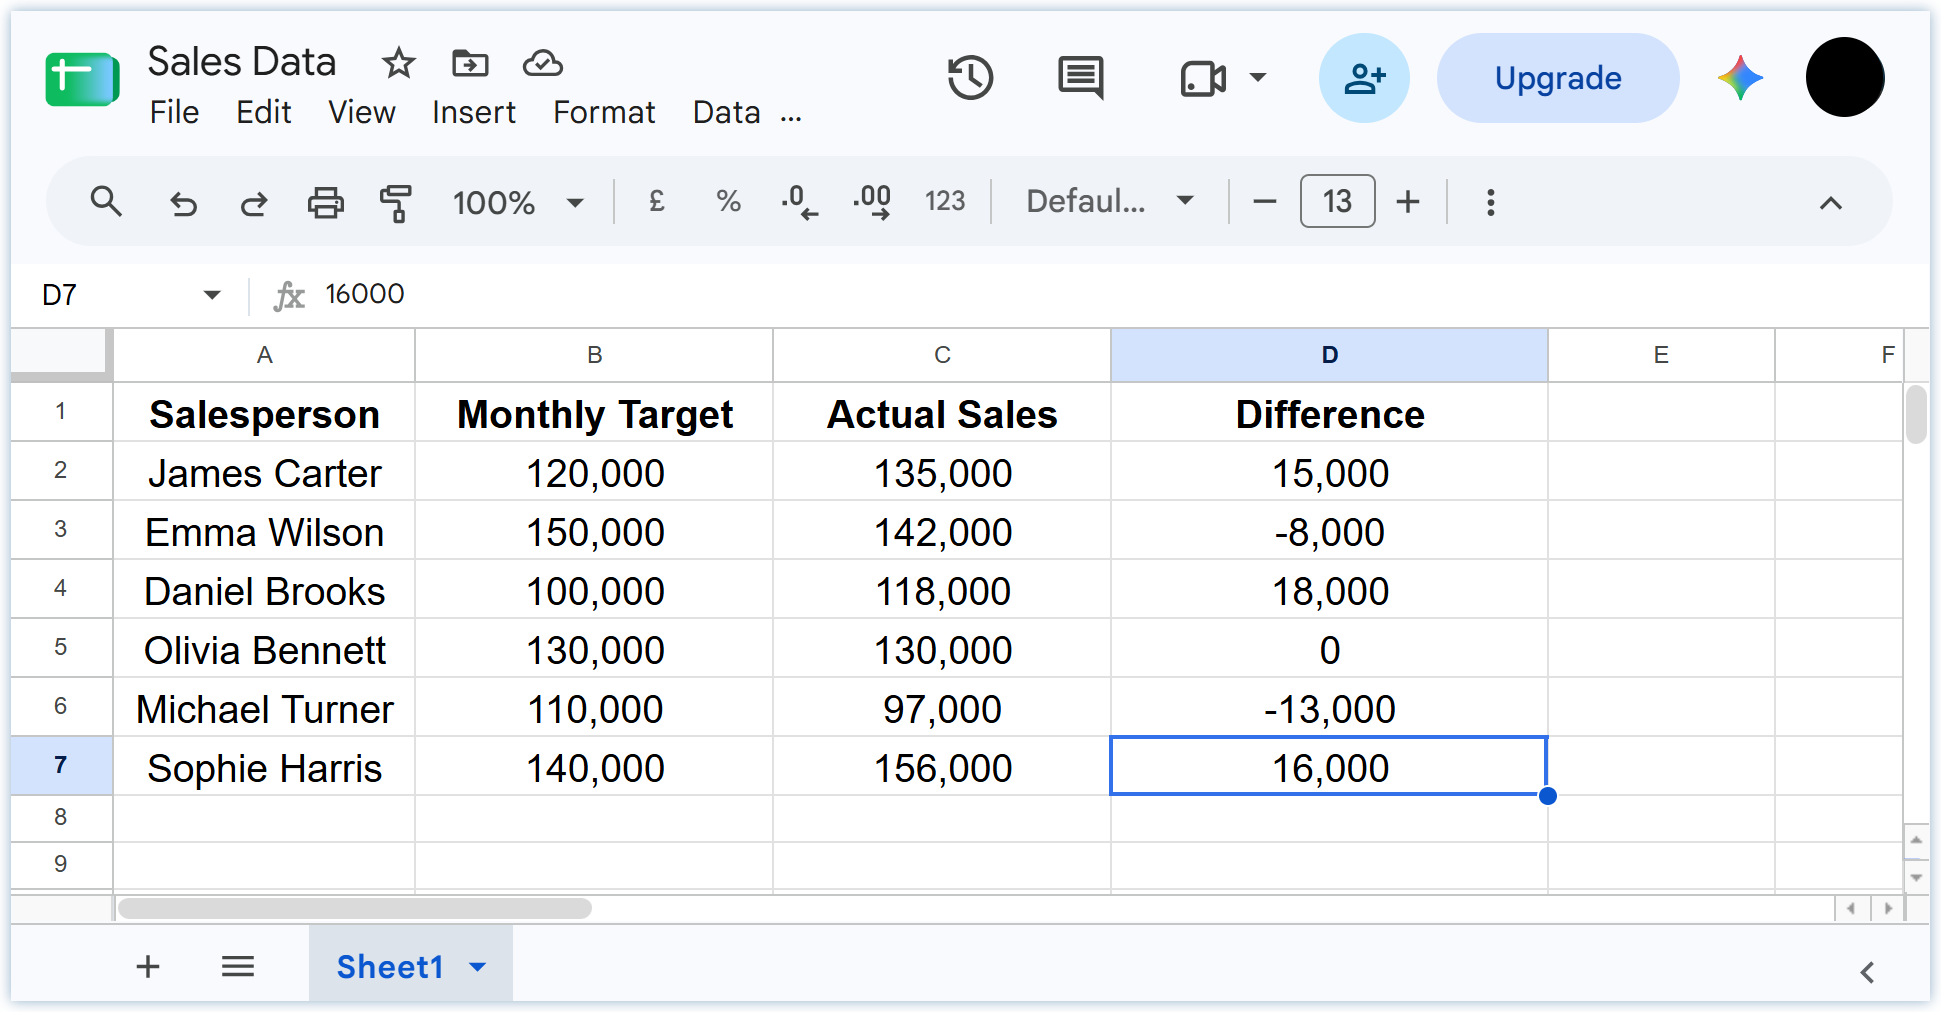
For example, a simple sales sheet might use a sequence like the one mentioned below:
- Column A for salesperson names
- Column B for monthly targets
- Column C for actual sales
- Column D for the difference between the two
Once a spreadsheet grows beyond a few rows, consistent structure becomes important. You can put headings in the first row, keep similar data in the same column, and avoid mixing unrelated information inside a single cell. A clean structure makes sorting, filtering, formulas, and charts much easier later.
You can also paste blocks of information directly from another spreadsheet, document, or supported data source. When copying data into an existing sheet, pay attention to formatting. Sometimes you need the values without the source formatting, in which case Paste Special -> Values Only is more useful than pasting normally.
A useful habit is to treat the spreadsheet as a dataset first and a visual document second. Get the rows and columns organized before spending too much time on colors, borders, and formatting.
How to Use AI in Google Sheets
Google has integrated Gemini in Google Sheets to help with common spreadsheet tasks. Gemini can help create tables, generate formulas, summarize or categorize text, identify trends and outliers, answer questions about your data, and build charts and graphs.
Using Gemini in Google Sheets
To use Gemini in Google Sheets, click the star icon at the top of your spreadsheet (Ask Gemini icon) to start using AI in Google Sheets. You can access different templates or use Gemini to help you with calculations. For example, you might ask Gemini to add up the sales figures in a column. Gemini can suggest the correct formula, which you can review before inserting it into the spreadsheet.
Gemini can also help analyze existing data by identifying patterns, summarizing findings, or creating charts from the sheet. Google also supports an AI function that can generate, summarize, or categorize text across multiple cells at once. The main caution is to review AI-generated formulas and analysis before relying on them, especially when they affect financial, reporting, or decision-making data.
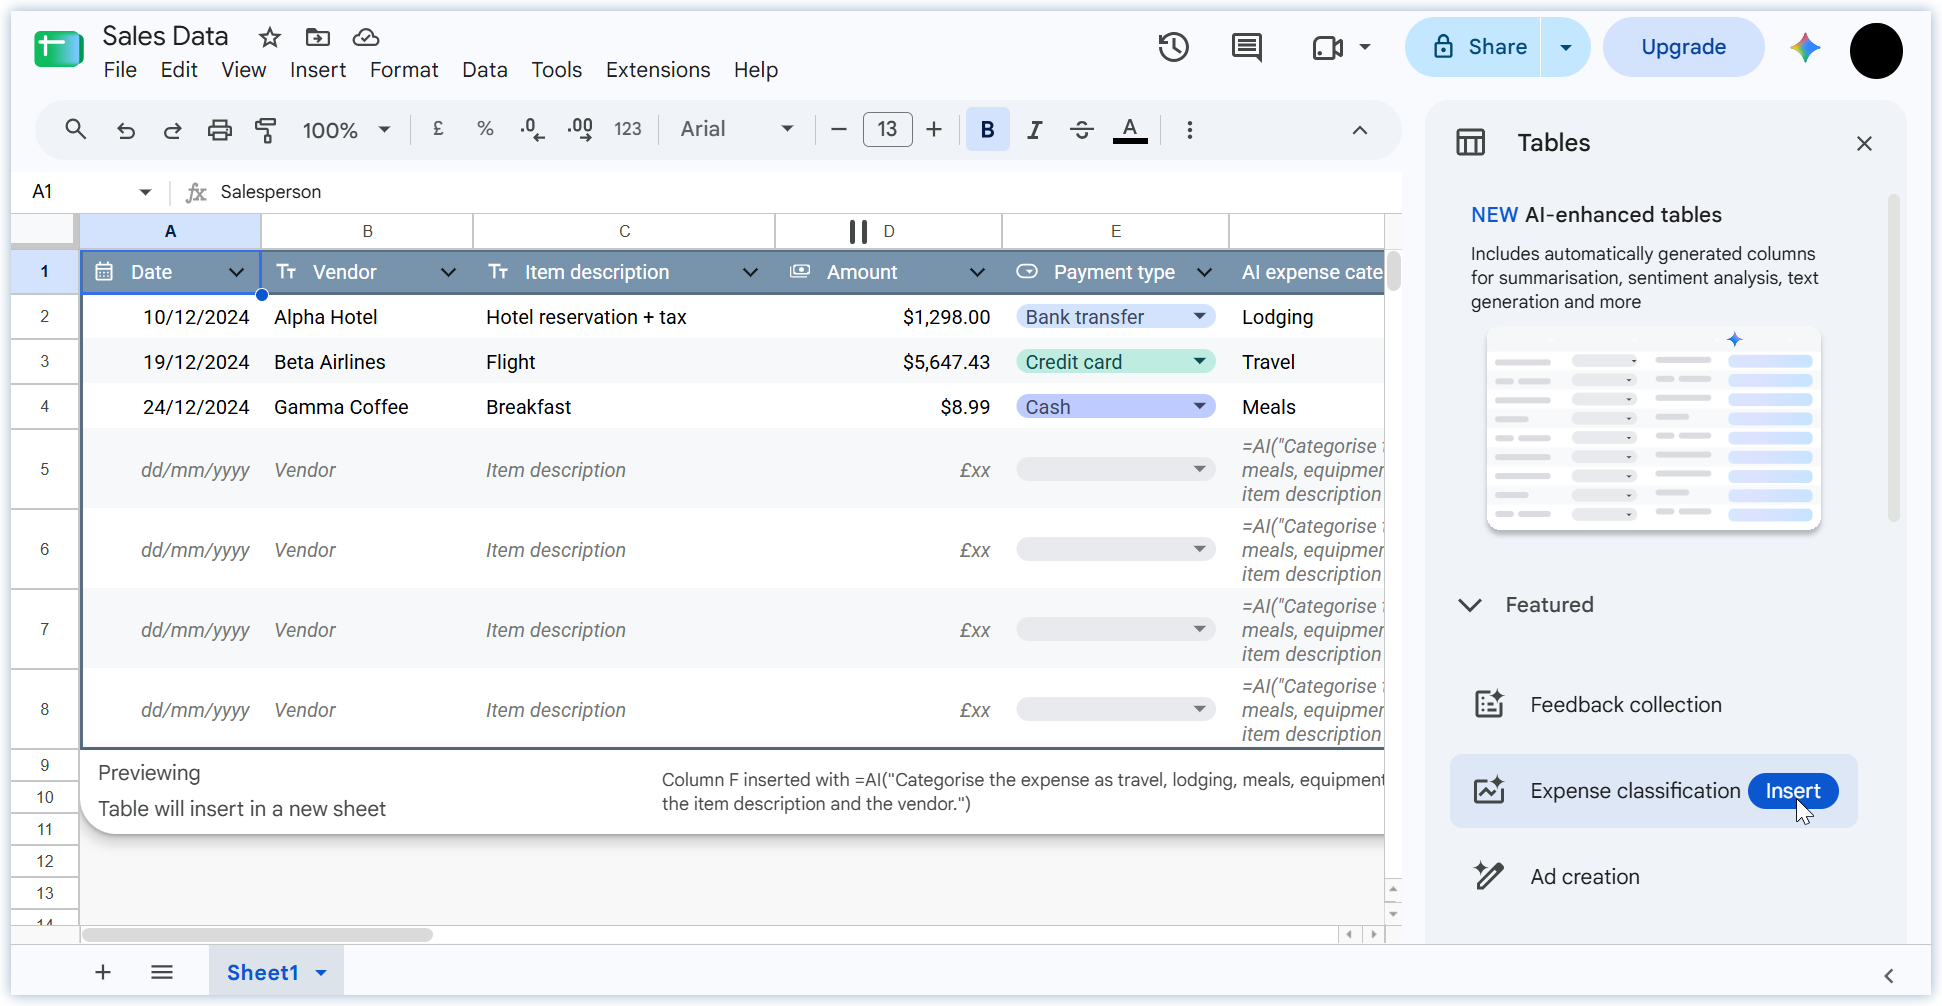
Here are some examples of what you can do with AI in Google Sheets:
- Generate Charts in Sheets: You can prompt Gemini in Google Sheets to analyze your data and create dynamic charts and visualizations that you can later use in your slides.
- Reference Spreadsheets in Slides: When building a presentation, you can link or upload your Google Sheets data as a source file so Gemini builds accurate, context-aware slides.
- Table & Spreadsheet Generation: Describe what you need (like a project status tracker or event schedule) and Gemini will build a custom layout or template that you can insert directly.
- Canvas Feature: Turn flat spreadsheet data into visual presentations and dashboards with simple prompts.
- Data Analysis: Highlight data or right-click to get automatic summaries, trend breakdowns, and key metrics without writing complex formulas.
- Use the Native
=AI()and=Gemini()Functions: You can write AI prompts inside a cell just like a normal formula to summarize text, categorize data, or extract info. Use it like=AI("Summarize this feedback", A2)
Basic Functions and Formulas
Once data is organized, formulas allow Google Sheets to calculate, compare, and transform that information automatically. A formula begins with an equals sign. Functions are predefined operations that save you from building common calculations manually. Some of the most useful basic Google Sheets functions are listed below with examples:
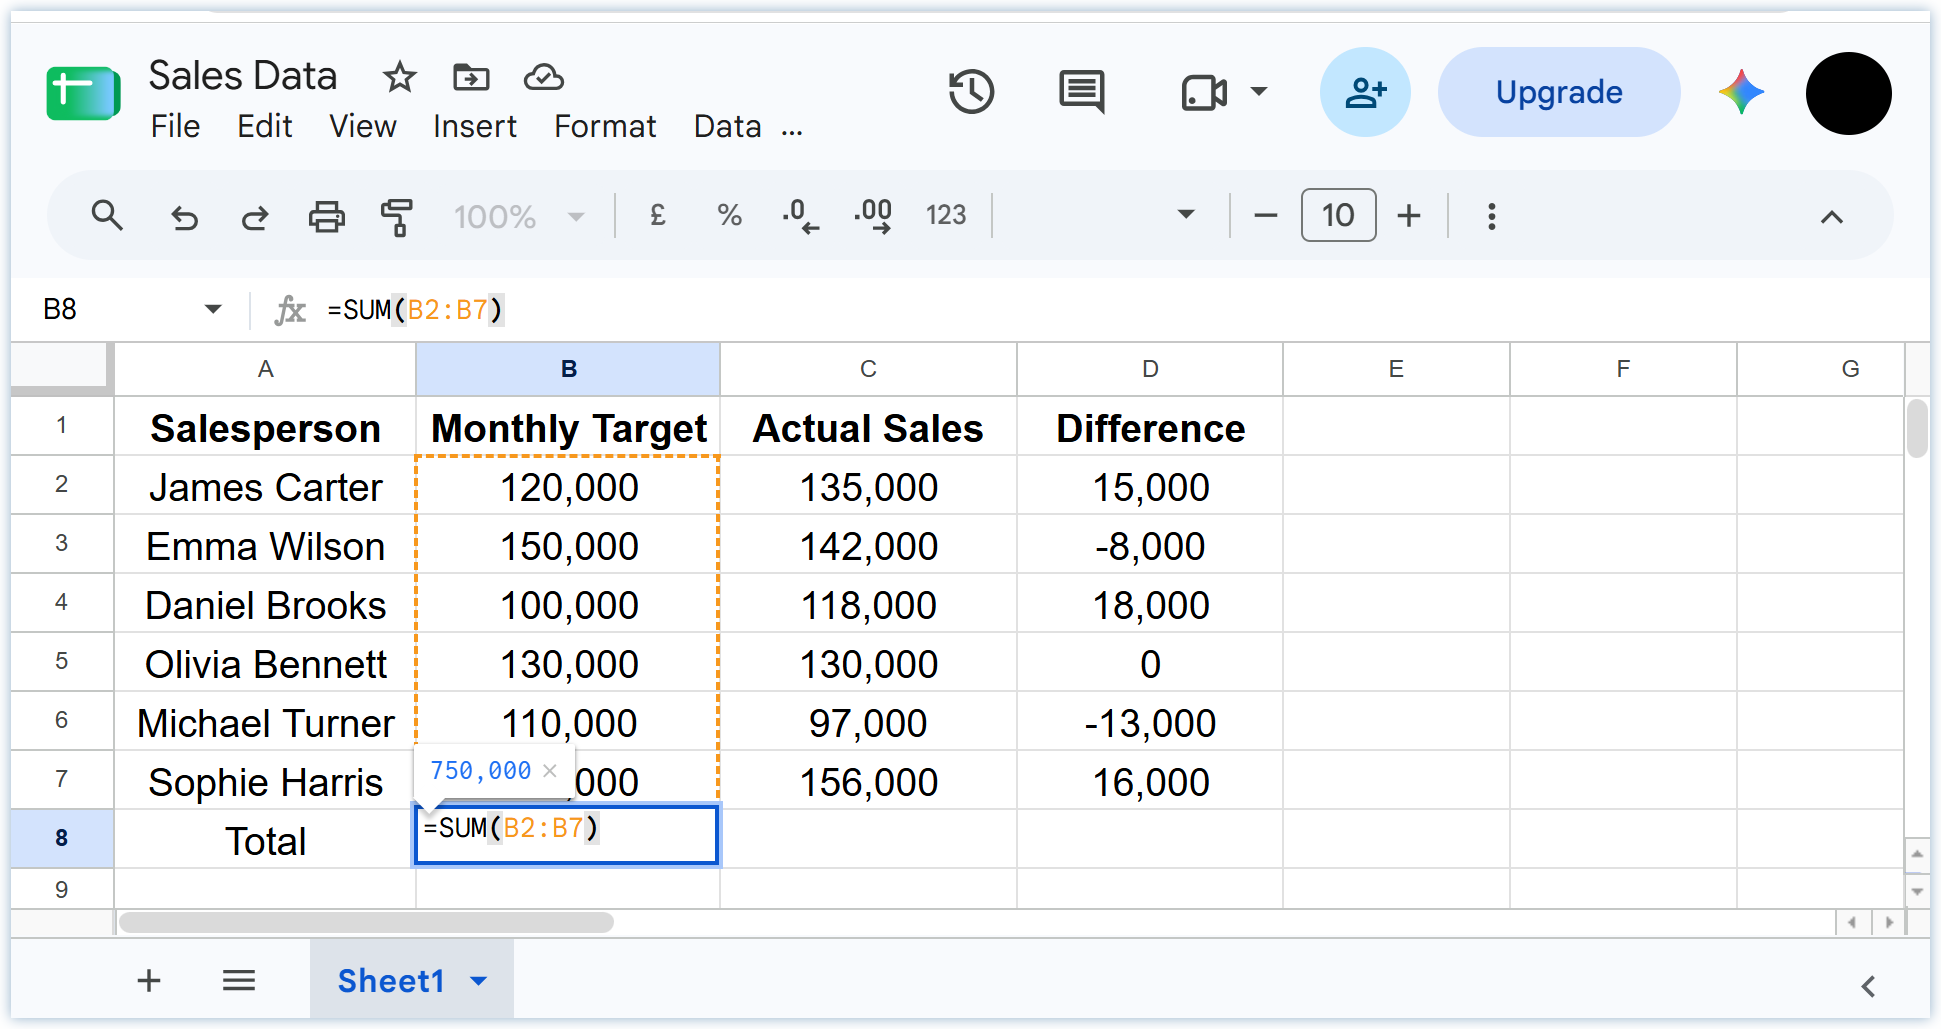
Sum: =SUM(B2:B10) adds the values in cells B2 through B10.
Minus: =B2-C2 subtracts the value in C2 from the value in B2.
Average: =AVERAGE(B2:B10) calculates the average of that range.
Count: =COUNT(B2:B10) counts cells containing numbers.
Maximum: =MAX(B2:B10) returns the largest value.
Minimum: =MIN(B2:B10) returns the smallest value.
These functions are simple, but they form the basis of much everyday spreadsheet work. More advanced formulas usually build on the same logic by combining cell references, ranges, functions, and conditions.
How to Use Google Sheets Formulas
Google Sheets formulas become more useful once you understand three basic parts: the equals sign, cell references, and ranges.
Every formula begins with =. A formula can reference individual cells, such as =B2+C2, or a range such as B2:B20. A colon tells Sheets to include every cell between the two references.
For example:
=SUM(C2:C20) adds every numeric value from C2 through C20.
You can also combine functions with conditions. One of the most useful examples is IF, which returns one result when a condition is true and another when it is false.
For a sales tracker, you might use:
=IF(C2>=B2,”Target Met”,”Below Target”)
If the actual sales figure in C2 is equal to or higher than the target in B2, Sheets returns Target Met. Otherwise, it returns Below Target.
Cell references become especially important when formulas are copied. If you drag that formula down a column, Google Sheets automatically adjusts the row references. The next row becomes C3>=B3, then C4>=B4, and so on. This is much faster than writing the same calculation repeatedly.
For business spreadsheets, it is worth checking formulas before filling them across a large dataset. A misplaced range can produce perfectly valid calculations using the wrong data, which is harder to notice than an obvious formula error.
Sharing a Google Sheet with Others
Collaboration is one area where Google Sheets is particularly useful. Instead of emailing multiple spreadsheet versions back and forth, several people can work inside the same file and see changes as they happen.
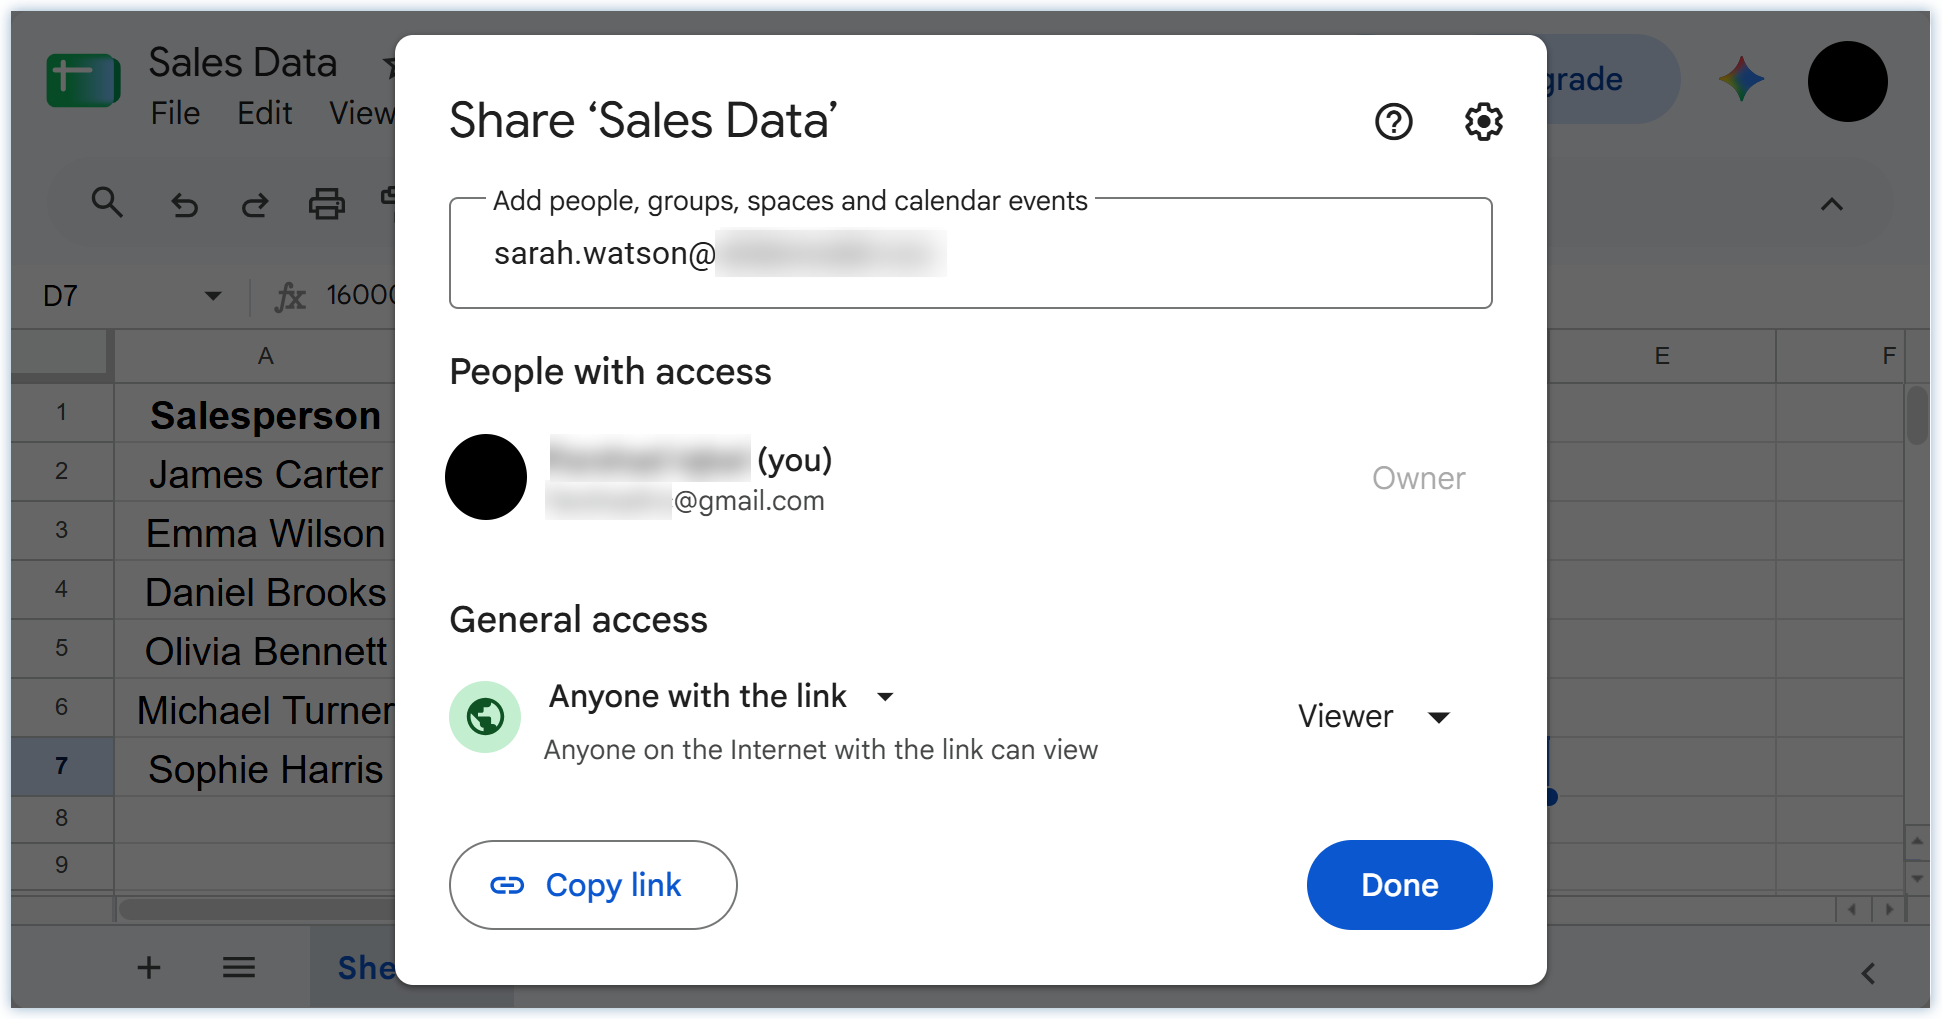
To start using Google Sheets collaboration features, click Share and add the people who need access. Then assign the appropriate permission level. You can also share a link rather than adding people individually. Depending on the organization’s settings, link access may be limited to specific users, people within the organization, or anyone with the link.
- Viewer: This type of access works when someone only needs to read the spreadsheet.
- Commenter: Commenter access lets users leave feedback without directly changing the data.
- Editor: As an Editor, you can allow collaborators to modify the spreadsheet itself.
When sharing a Google Sheets file with business or financial information, resist the temptation to give everyone Editor access. Assigning the lowest permission level someone actually needs reduces the chances of accidental changes. Furthermore, be careful with the Anyone with the link permission. As the name implies, if you share your URL, anyone can access your data.
Tips and Tricks for Using Google Sheets
Once the basic workflow feels familiar, a few habits can make Google Sheets considerably faster to work with.
How to Add Charts and Graphs to Google Sheets
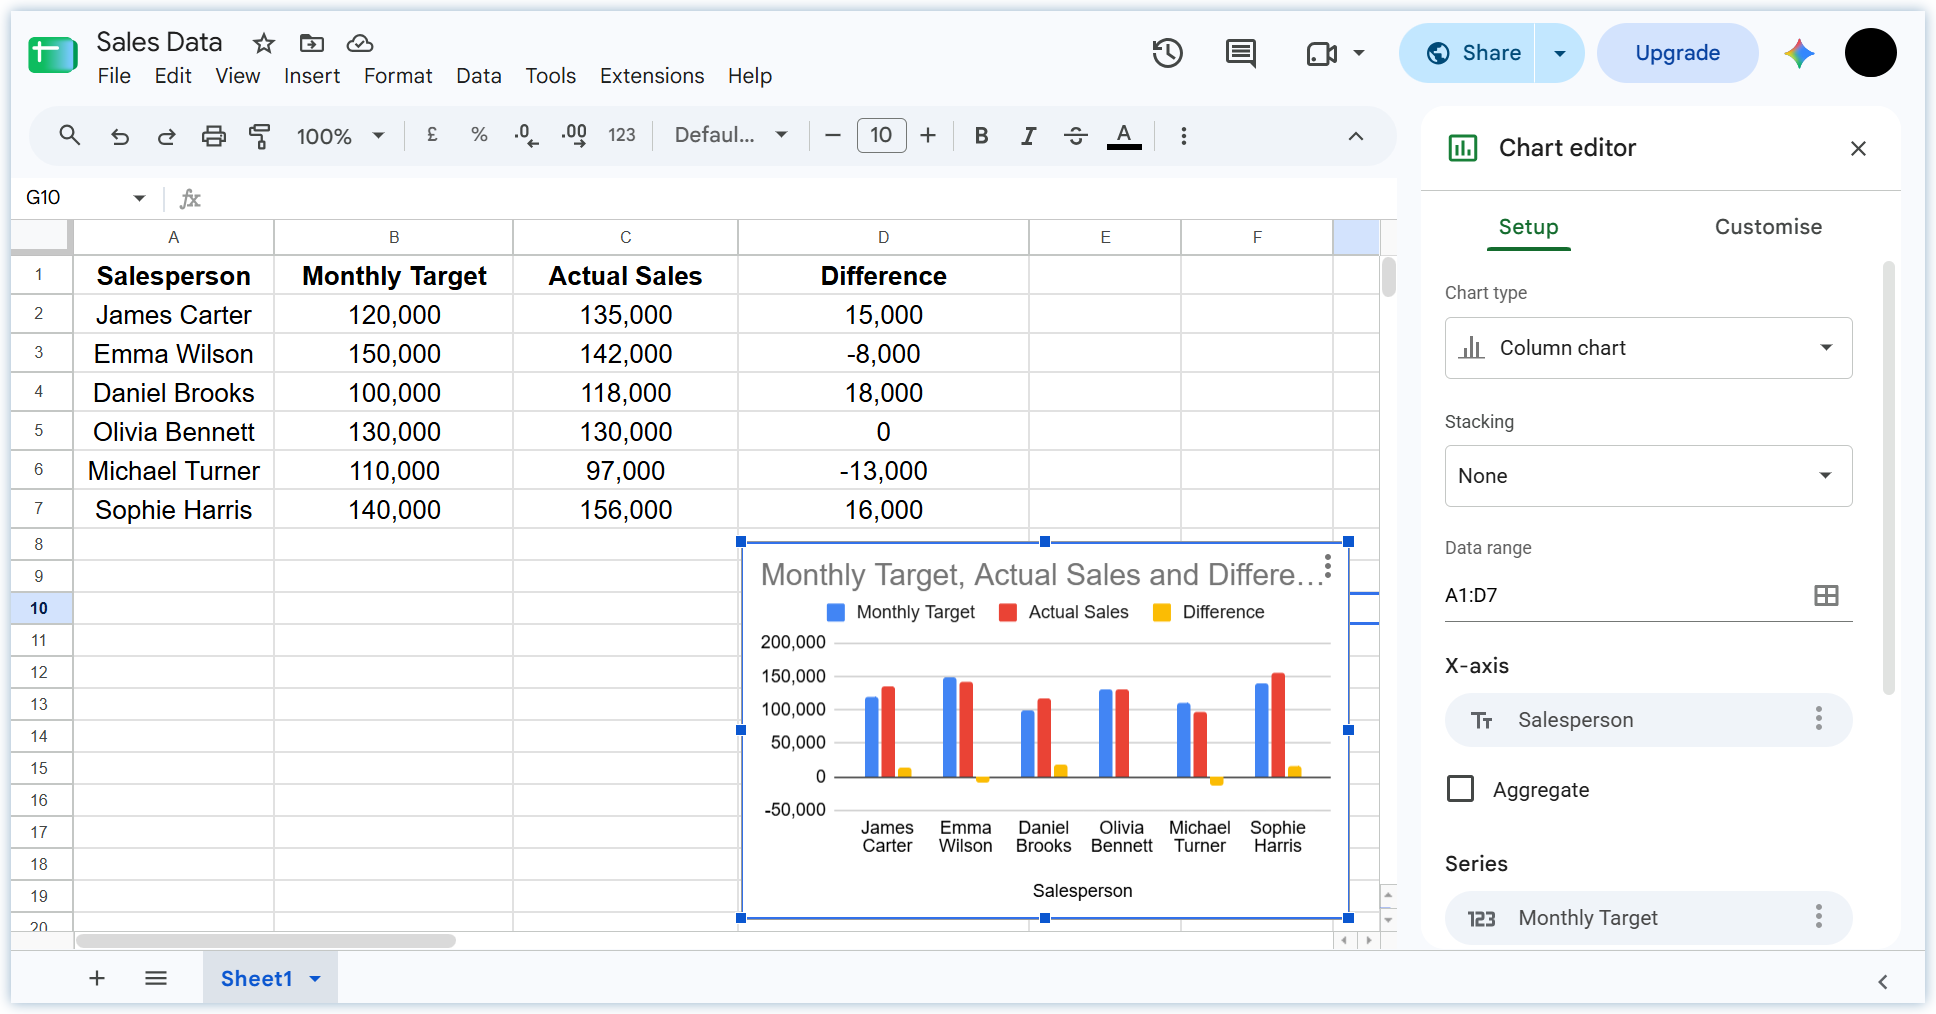
To create a visualization, select the relevant data and go to Insert -> Chart. Google Sheets creates an initial chart and opens the Chart editor, where you can change the data range, chart type, labels, and other settings.
Do not assume the first chart Sheets suggests is automatically the right one. The choice should depend on the question the data needs to answer. A line chart can work well for change over time, while a bar or column chart may be better for comparing categories.
It is also useful to understand the practical distinction between charts vs. graphs when deciding how to communicate quantitative information. Keep the source data clean before creating the visualization. Clear column headings and consistent values make it much easier for Sheets to interpret the dataset correctly.
Once the spreadsheet is complete, the next challenge is often turning the analysis into something an audience can understand quickly. Moving from spreadsheet to presentation means deciding which numbers actually support the message rather than copying an entire worksheet into a presentation.
Using Keyboard Shortcuts in Google Sheets
You can operate much of Google Sheets without reaching for the mouse, which becomes increasingly useful when entering or cleaning large amounts of data. Below are some practical Google Sheets keyboard shortcuts. If you are new to Google Sheets, you do not need to memorize every shortcut at once. Start with the actions you repeat most often, then build from there.
- Copy: Ctrl+C (Windows) or Command+C (Mac)
- Cut: Ctrl+X (Windows) or Command+X (Mac)
- Paste: Ctrl+V (Windows) or Command+V (Mac)
- Paste values only: Ctrl+Shift+V (Windows) or Command+Shift+V (Mac)
- Undo: Ctrl+Z (Windows) or Command+Z (Mac)
- Find: Ctrl+F (Windows) or Command+F (Mac)
- Find and Replace: Ctrl+H (Windows) or Command+Shift+H (Mac)
- Select an Entire Row: Shift+Space
- Select an Entire Column: Ctrl+Space (Windows) or Command+Space (Mac)
Conclusions
Learning Google Sheets starts with understanding the grid, entering data consistently, and using formulas to turn raw values into useful information. From there, Sheets becomes more powerful through sharing, charts, keyboard-driven workflows, and AI assistance through Gemini.
For most users, the biggest improvement comes from keeping spreadsheets structured. Clean columns and consistent data make formulas easier to audit, charts easier to build, and collaboration less confusing. Gemini can speed up parts of the process, particularly when generating formulas or working through unfamiliar tasks, but the spreadsheet still needs human review. The numbers, assumptions, and formulas ultimately need to make sense before they are used for reporting or decision-making.
FAQs
Is Google Sheets free to use?
Google Sheets is available to users with a Google account. Google Workspace business plans provide additional administrative, collaboration, storage, and AI capabilities depending on the subscription.
Can Google Sheets open Excel files?
Google Sheets can work with Microsoft Excel files, making it useful when collaborating with people who use different spreadsheet applications. Some complex Excel-specific functionality may not transfer exactly, so check important workbooks after conversion.
What is the difference between a formula and a function in Google Sheets?
A formula is an expression that performs a calculation, such as =B2-C2. A function is a predefined operation used inside a formula, such as SUM, AVERAGE, or IF.
Can Gemini create formulas in Google Sheets?
Gemini can help generate formulas and other spreadsheet tasks with AI when the feature is available to your Google account. Review the suggested formula before applying it across a large dataset, particularly when the calculation affects reporting or financial information.
Can multiple people edit a Google Sheet at the same time?
Yes. Users with Editor permission can work in the same spreadsheet simultaneously, and comments and other collaboration tools let you discuss specific cells without maintaining separate versions of the file.
Can you add comments to Google Sheets?
You can attach comments to individual cells when feedback relates to a specific figure or entry. Collaborators can reply within the comment thread or mention another user to draw their attention to a particular issue without changing the spreadsheet itself.