Slide 25 of 38 from Free Timeline Infographics
Curved Line Multistage Timeline Slide
Timeline Infographics for Presentations
- Diagram
- Timeline Horizontal
- Timeline Slide
- 16:9
- 100% Editable
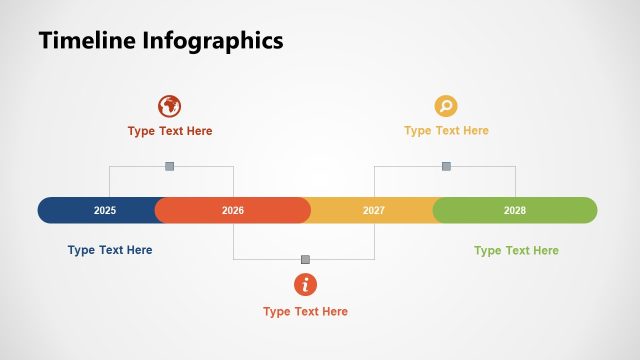
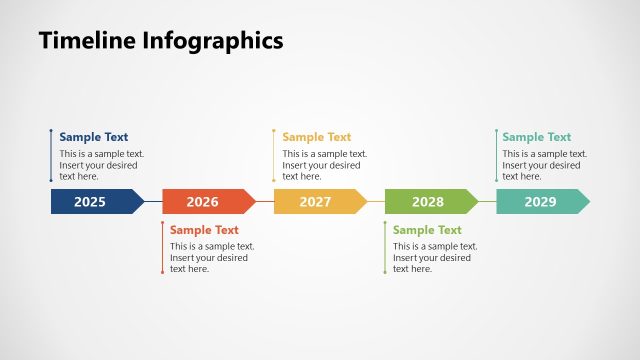
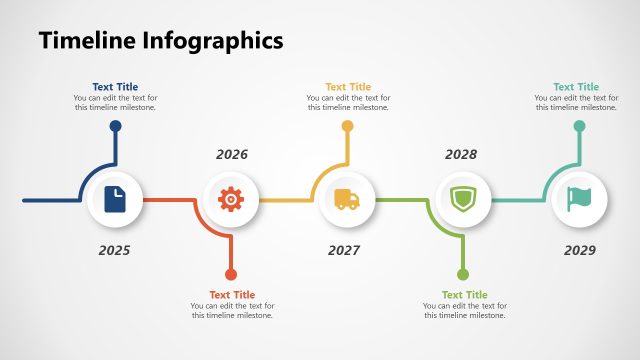
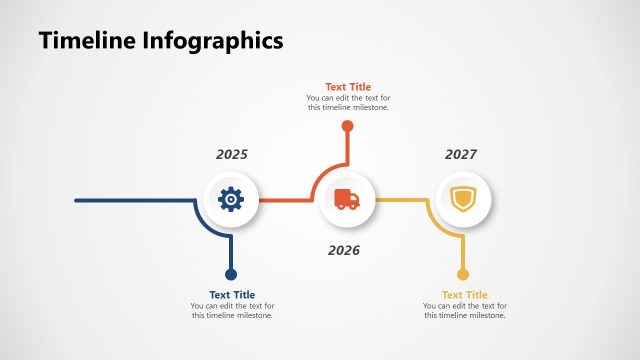
The Timeline Infographics slide from the Free Timeline Infographics template provides a visually engaging way to present project timelines and event schedules. Featuring a wavy design with five key years highlighted, this editable slide allows users to effectively communicate historical overviews and milestones. The layout's blue color scheme and clear text placeholders enhance readability, making it an excellent choice for business presentations and pitch decks.
What’s on This Slide
The layout features a wavy timeline with five key years displayed: 2024, 2025, 2026, 2027, and 2028. Each year is represented by a circular node, with corresponding text placeholders positioned below each year for additional details. The timeline flows horizontally across the slide, with a blue color scheme dominating the design. The background is a light gray, providing contrast to the blue elements. Text placeholders are aligned centrally beneath each year, maintaining a consistent visual hierarchy throughout the layout.
How to Use It
This layout serves as a chronological process visualization, ideal for showcasing project milestones or historical events. It fits within a presentation sequence after problem framing and before strategic analysis. Real-world applications include project planning, product development timelines, or event scheduling, allowing audiences to easily follow progress over time. The wavy design adds visual interest while maintaining clarity in the timeline structure.
Text Placeholders & Capacity
Keep your copy within these limits so it fits without resizing. Node body slots can accommodate roughly 20 characters each.
| Placeholder | Count | Max characters (approx.) |
|---|---|---|
| Item heading | 5 | 4 |
| Item body | 5 | 20 |
Slide Keywords
Download unlimited PowerPoint templates, charts and graphics for your presentations with our annual plan.
DOWNLOADReturn to Free Timeline Infographics.