Slide 36 of 38 from Free Timeline Infographics
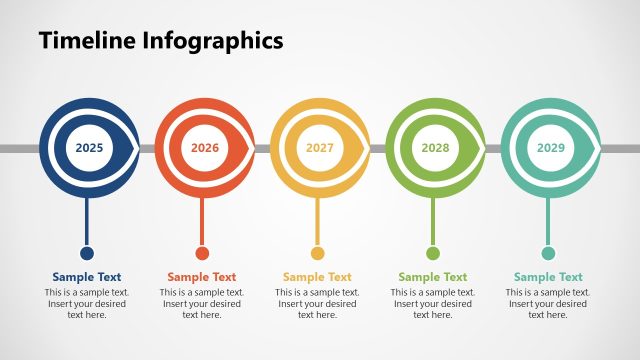
Five Bookmark Icons Process Diagram Slide
Timeline Infographics for Presentations
- Diagram
- Timeline Horizontal
- Timeline Slide
- 16:9
- 100% Editable
What’s on This Slide
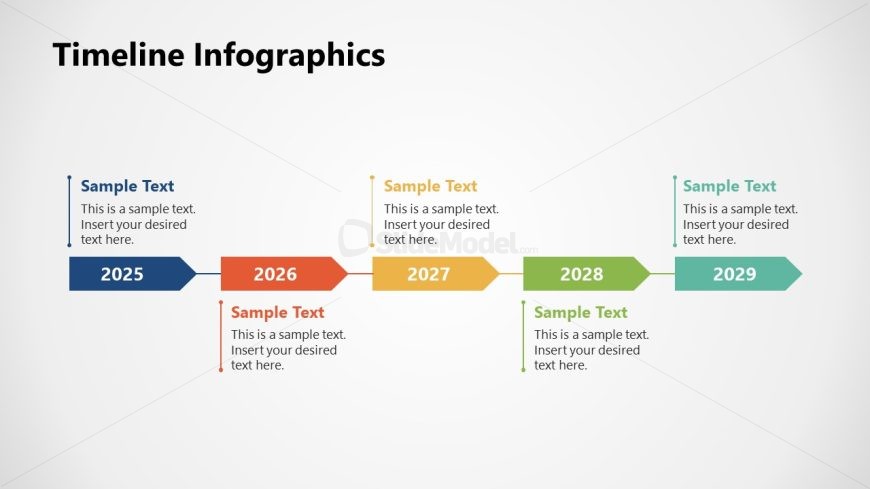
The layout features a horizontal timeline with five distinct year markers: 2025, 2026, 2027, 2028, and 2029. Each year is represented by a colored rectangular shape, with the year label prominently displayed. Below each year, there are text placeholders aligned centrally, allowing for additional descriptive content. The timeline is connected by horizontal lines, creating a clear flow from left to right. The overall background is light, enhancing the visibility of the colored elements. Each year marker is visually distinct, contributing to a structured layout.
How to Use It
This layout serves as a chronological timeline, ideal for illustrating project milestones or historical events. It fits well in presentations that require a clear sequence of events or progress over time. This structure is useful in business contexts, such as project planning, product launches, or strategic roadmaps. It can also be applied in educational settings to depict historical timelines or learning objectives across years. The layout effectively communicates temporal relationships in a visually organized manner.
Text Placeholders & Capacity
Keep your copy within these limits so it fits without resizing. Node body slots can accommodate roughly 10 words each.
| Placeholder | Count | Max characters (approx.) |
|---|---|---|
| Item heading | 5 | 10 |
| Item body | 5 | 50 |
Slide Keywords
Download unlimited PowerPoint templates, charts and graphics for your presentations with our annual plan.
DOWNLOADReturn to Free Timeline Infographics.