Slide 20 of 38 from Free Timeline Infographics
Segmented Bar Timeline Diagram for PowerPoint
Free Timeline Infographics for Presentations
- Diagram
- Timeline Horizontal
- Timeline Slide
- 16:9
- 100% Editable
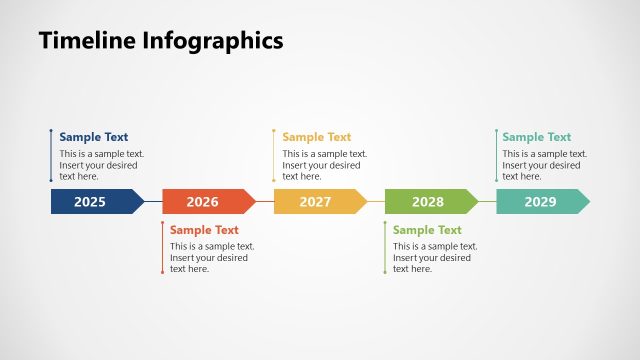
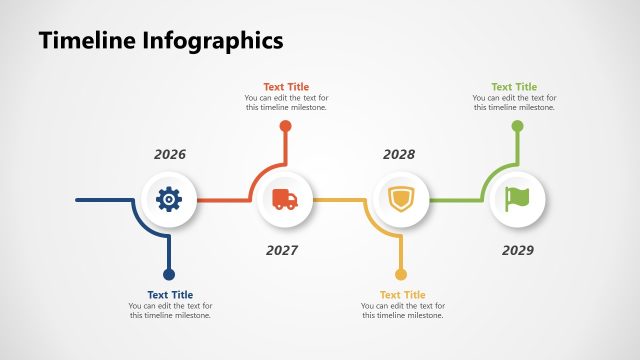
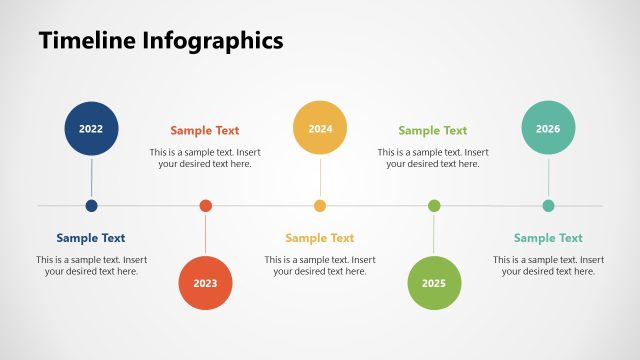
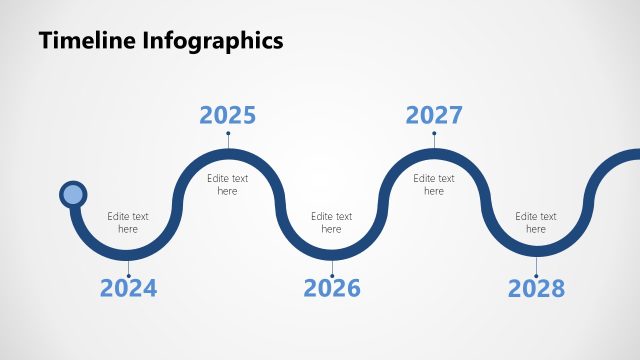
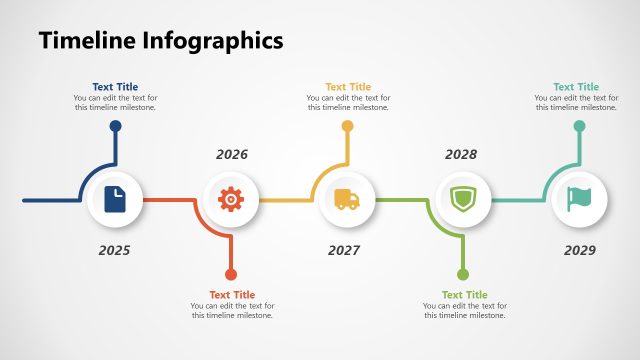
The Timeline Infographics slide from the Free Timeline Infographics template provides a clear visual representation of chronological data. This editable slide layout is perfect for showcasing project timelines, historical events, and strategic planning. With its horizontal design and distinct colored nodes for each year, it effectively communicates progress and milestones in a business presentation or educational context.
What’s on This Slide
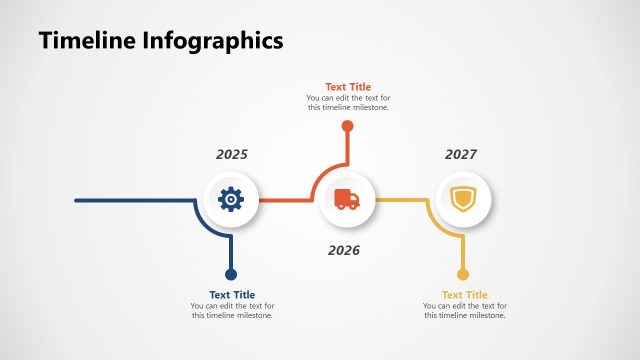
The slide features a horizontal timeline with five key years: 2025, 2026, 2027, and 2028. Each year is represented by a colored circular node, with 2025 in blue, 2026 in orange, 2027 in yellow-green, and 2028 in green. Text placeholders are positioned above and below the timeline, aligned centrally with each year. An information icon is located below the timeline, with a corresponding text placeholder. The overall background is light, enhancing the visibility of the timeline elements. The layout emphasizes a clear progression from left to right.
How to Use It
This layout serves as a chronological timeline, ideal for illustrating project milestones or historical events. It fits well in presentations that require a visual representation of time-based data. Use this slide when detailing a project plan, showcasing product development phases, or mapping out strategic initiatives over several years. It can also be effective for educational purposes, such as teaching historical timelines or significant events in a subject area.
Text Placeholders & Capacity
Keep your copy within these limits so it fits without resizing. Node labels can hold about 10 characters each, while body slots can accommodate roughly 50 characters.
| Placeholder | Count | Max characters (approx.) |
|---|---|---|
| Slide title | 1 | 30 |
| Item heading | 4 | 10 |
| Item body | 5 | 50 |
Slide Keywords
Download unlimited PowerPoint templates, charts and graphics for your presentations with our annual plan.
DOWNLOADReturn to Free Timeline Infographics.