Slide 15 of 22 from Free Professional Thesis PowerPoint Templates
Data Driven Bar Chart Thesis Template
Results Bar Chart for Thesis Presentation
- Chart
- Bar Horizontal
- Evaluation Slide
- 16:9
- 100% Editable
The Results Bar Chart slide from the Free Professional Thesis PowerPoint Templates offers a clear horizontal bar chart layout ideal for academic presentations and business performance reviews. This slide template supports effective communication of multi-year data comparisons using editable shapes and vector icons, enhancing research findings and project updates in professional slide decks.
What’s on This Slide
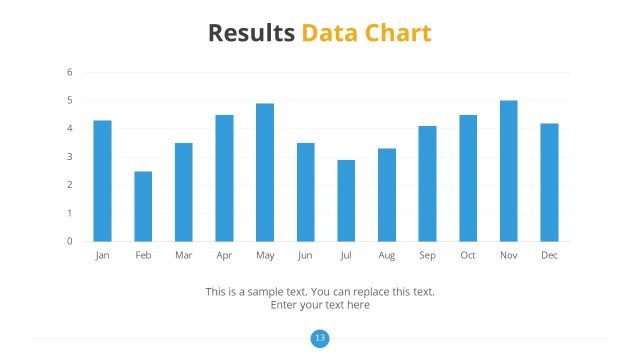
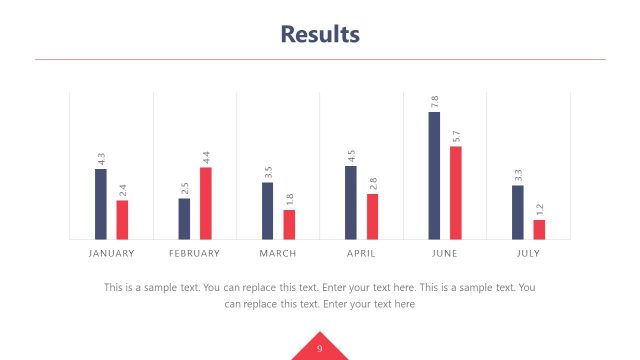
The slide features a horizontal bar chart positioned centrally, displaying three bars for each year: 2018, 2019, and 2020. The bars are colored in alternating shades of blue and gray, with the longest bars representing higher values. Above the chart, the title 'Results Bar Chart' is prominently displayed in a large, bold font, with 'Results' in gray and 'Bar Chart' in yellow. Below the chart, there are two text placeholders for sample text, aligned centrally, allowing for additional context or explanations.
How to Use It
This layout serves to present comparative data over multiple years, making it suitable for academic or business presentations. It fits well in a sequence following an introduction or methodology slide, where results need to be highlighted. This format is ideal for showcasing performance metrics, survey results, or any quantitative analysis that requires clear visual representation. It can be used in research presentations or project updates to effectively communicate findings.
Text Placeholders & Capacity
Keep your copy within these limits so it fits without resizing. Body slots can accommodate roughly 10-15 words each.
| Placeholder | Count | Max characters (approx.) |
|---|---|---|
| Chart title | 1 | 30 |
| Body paragraph | 2 | 50 |
Slide Keywords
Download unlimited PowerPoint templates, charts and graphics for your presentations with our annual plan.
DOWNLOAD