Slide 3 of 5 from Free Diversity Report Slide Template
Data-Driven Bar Chart Slide Template – Diversity Report PPT Template
Diversity Report: Ethnicity Analysis Chart
- Chart
- Bar Vertical
- Evaluation Slide
- 16:9
- 100% Editable
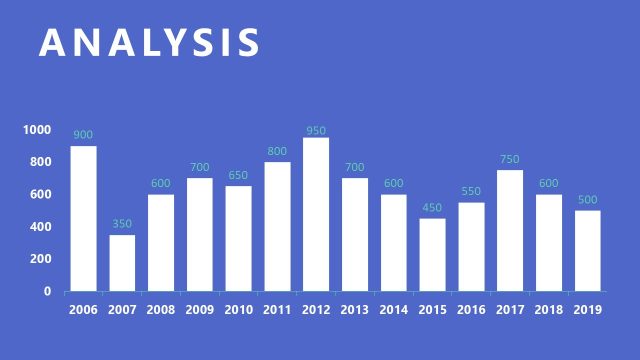
The Bar Chart of Ethnicities slide from the Free Diversity Report Slide Template is designed for effective data presentation and diversity analysis. This visually engaging slide features a centrally positioned bar chart that allows for easy comparison of various ethnicities, making it an essential tool for corporate presentations and reports on social equity.
What’s on This Slide
The slide features a bar chart positioned centrally, displaying five bars representing different ethnicities. Each bar is labeled at the bottom with the corresponding ethnicity name. The vertical axis indicates a numerical scale from 0 to 7, while the horizontal axis lists the ethnicities. The chart has a dark color scheme for the bars against a light background, enhancing visibility. The title 'ETHNICITY' is prominently placed above the chart, and a subtitle 'ANALYSIS' appears in the top left corner. A footer indicates the slide number.
How to Use It
This layout serves as a data visualization tool to present comparative statistics on ethnic diversity. It fits within a presentation sequence that analyzes various diversity metrics, following slides that may introduce the topic. This structure is useful for organizations assessing their demographic representation or for reports on social equity. It effectively communicates trends and disparities in ethnicity representation, making it suitable for diversity training or corporate social responsibility discussions.
Text Placeholders & Capacity
Keep your copy within these limits so it fits without resizing. Node labels can accommodate short names, roughly 2-3 words each.
| Placeholder | Count | Max characters (approx.) |
|---|---|---|
| Chart title | 1 | 20 |
| Item heading | 5 | 15 |
| Footer | 1 | 10 |
Slide Keywords
Download unlimited PowerPoint templates, charts and graphics for your presentations with our annual plan.
DOWNLOADReturn to Free Diversity Report Slide Template.