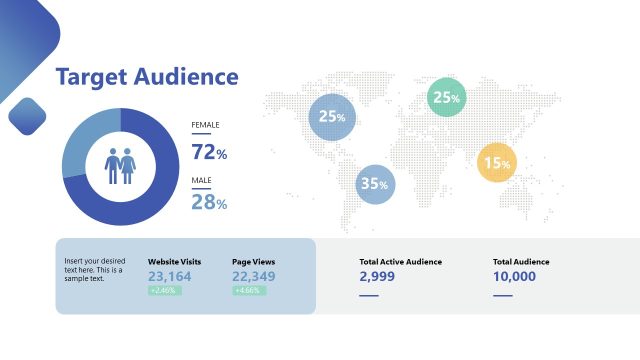
Slide 2 of 5 from Free Diversity Report Slide Template
Pie Chart Slide for Diversity Report Presentation
Diversity Analysis Charts for Reports
- Chart
- Pie Chart
- Analysis Slide
- 16:9
- 100% Editable
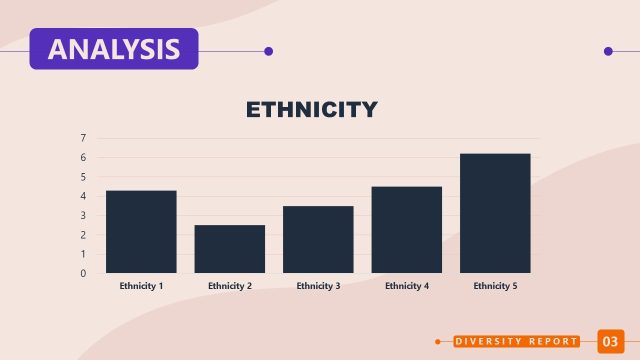
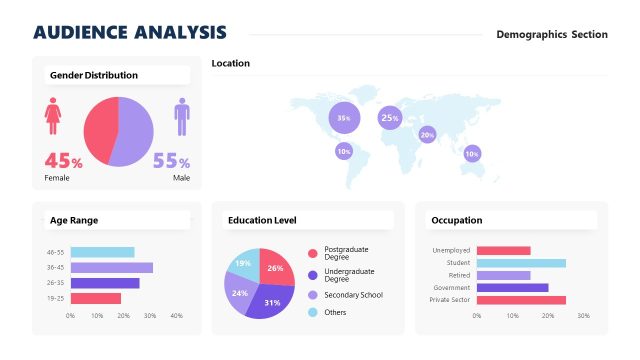
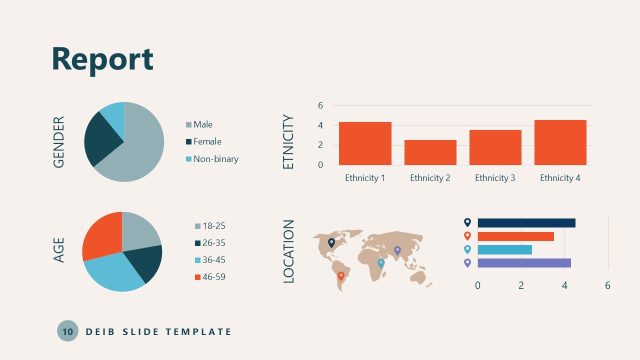
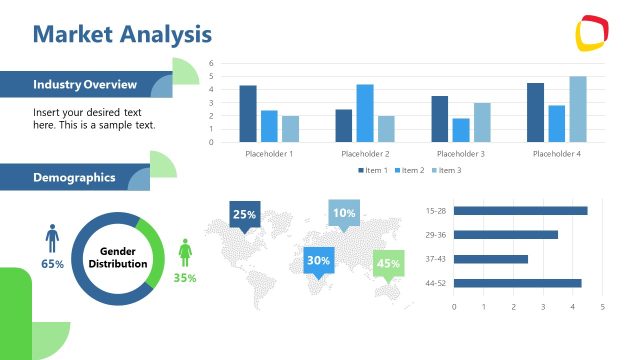
The Diversity Analysis Charts slide from the Free Diversity Report Slide Template effectively presents demographic insights through dual pie charts. This layout is ideal for stakeholders seeking to understand gender and age diversity metrics, enhancing business presentations with clear visual data representation.
What’s on This Slide
The slide features two pie charts positioned side by side, one for gender and one for age demographics. The gender chart is on the left, displaying segments for male, female, and non-binary categories, while the age chart is on the right, showing age ranges from 18-25 to 46-59. The title 'ANALYSIS' is centered at the top in bold text, with the labels 'GENDER' and 'AGE' above each chart. Color coding is used for clarity, with a light background and distinct colors for each segment. Text placeholders exist for titles and legends.
How to Use It
This layout serves to present demographic analysis through comparative pie charts, making it suitable for reports on diversity metrics. It fits well in a presentation sequence following introductory slides, providing a visual breakdown of gender and age data. This structure is useful in business contexts such as diversity training sessions, annual reports, or stakeholder meetings, where demographic insights are crucial for decision-making.
Text Placeholders & Capacity
Keep your copy within these limits so it fits without resizing. Node labels can hold around 10 characters each.
| Placeholder | Count | Max characters (approx.) |
|---|---|---|
| Slide title | 1 | 20 |
| Item heading | 2 | 10 |
| Item body | 2 | 30 |
| Legend | 2 | 20 |
Slide Keywords
Download unlimited PowerPoint templates, charts and graphics for your presentations with our annual plan.
DOWNLOADReturn to Free Diversity Report Slide Template.