Slide 4 of 5 from Free Diversity Report Slide Template
Map Slide for Diversity Report PPT Template
Location Analysis Slide for Diversity Report
- Diagram
- Other
- Analysis Slide
- 16:9
- 100% Editable
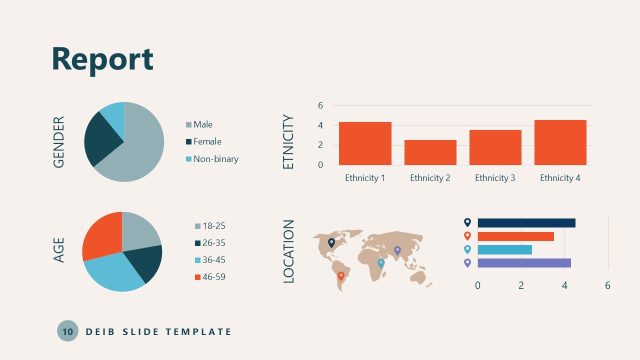
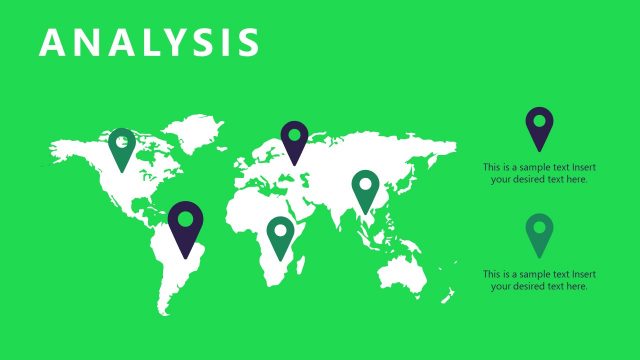
The Location Analysis with Chart slide from the Free Diversity Report Slide Template effectively combines a world map and a bar chart for insightful data visualization. This layout is ideal for presenting location analysis in diversity reporting, allowing users to showcase geographic data alongside comparative metrics. The editable slides provide a professional framework for business presentations or educational settings, enhancing the understanding of diversity metrics.
What’s on This Slide
The slide features a world map positioned on the left, colored in orange with location markers in various colors. To the right, a horizontal bar chart displays data with four bars in different shades of blue and purple. The title 'ANALYSIS' is at the top left, and 'LOCATION' is prominently displayed below it. Text placeholders exist for the title and chart labels, aligned to the left and centered respectively. The background is a soft peach color, enhancing the visibility of the map and chart elements.
How to Use It
This layout serves as a location analysis for diversity reports, effectively visualizing geographic data alongside a comparative chart. It fits well in a sequence that discusses various analytical aspects of diversity, such as gender or ethnicity. This structure is useful for presenting data-driven insights in business meetings, reports, or educational settings, where geographical representation is essential for understanding diversity metrics.
Text Placeholders & Capacity
Keep your copy within these limits so it fits without resizing. Node labels can accommodate roughly 10 characters each.
| Placeholder | Count | Max characters (approx.) |
|---|---|---|
| Slide title | 1 | 20 |
| Item heading | 4 | 10 |
| Item body | 4 | 10 |
Slide Keywords
Download unlimited PowerPoint templates, charts and graphics for your presentations with our annual plan.
DOWNLOADReturn to Free Diversity Report Slide Template.