Slide 5 of 8 from Free Environmental Consulting Slide Template
Editable Slide with Columns Chart – Free Environmental Consulting Presentation Template
Bar Chart Analysis for Environmental Consulting
- Chart
- Bar Vertical
- Evaluation Slide
- 16:9
- 100% Editable
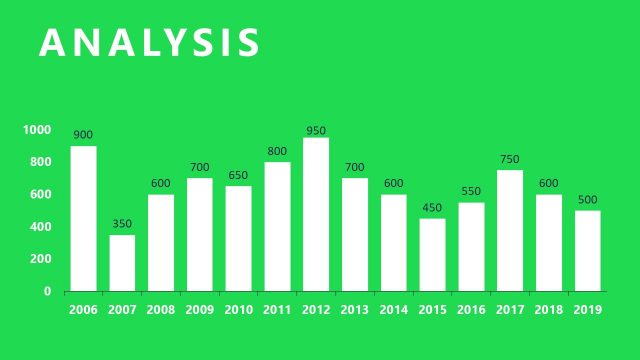
The Bar Chart Analysis slide from the Free Environmental Consulting Slide Template offers a clear and effective way to present data trends. Featuring a vertical bar chart that displays annual values from 2006 to 2019, this layout is ideal for financial reporting and data presentation. The clean design, with a solid blue background and green value labels, ensures that key metrics are easily understood, making it a valuable addition to any business presentation.
What’s on This Slide
The layout features a vertical bar chart positioned centrally, displaying data from 2006 to 2019. Each bar represents annual values, with heights varying from 350 to 950. The chart is set against a solid blue background, enhancing visibility. Above the chart, the title 'ANALYSIS' is prominently displayed in large white text. Each bar has a corresponding value label in green, positioned at the top of the bars. The overall composition is clean and straightforward, focusing on data representation without additional decorative elements.
How to Use It
This layout serves as a data visualization tool, ideal for presenting quantitative analysis in a clear format. It fits within a presentation sequence after introducing concepts or problems, effectively summarizing data trends over time. Suitable for business scenarios like environmental impact assessments, financial reports, or performance reviews, this chart can help stakeholders quickly grasp key metrics and changes across the years.
Text Placeholders & Capacity
Keep your copy within these limits so it fits without resizing. Data labels are tight, roughly 3 characters each.
| Placeholder | Count | Max characters (approx.) |
|---|---|---|
| Chart title | 1 | 20 |
| Data label | 14 | 4 |
Slide Keywords
Download unlimited PowerPoint templates, charts and graphics for your presentations with our annual plan.
DOWNLOADReturn to Free Environmental Consulting Slide Template.