Slide 8 of 8 from Free Business Slides for PowerPoint
Bar Chart PowerPoint Template
Bar Chart with Icons for Business Presentations
- Chart
- Bar Vertical
- Evaluation Slide
- 16:9
- 100% Editable
What’s on This Slide
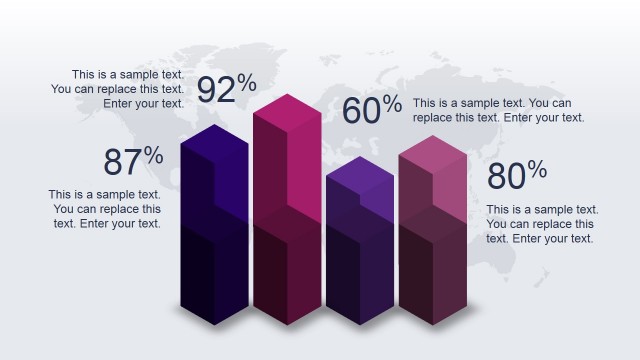
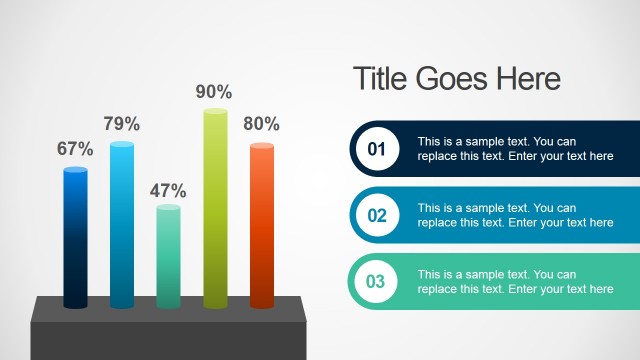
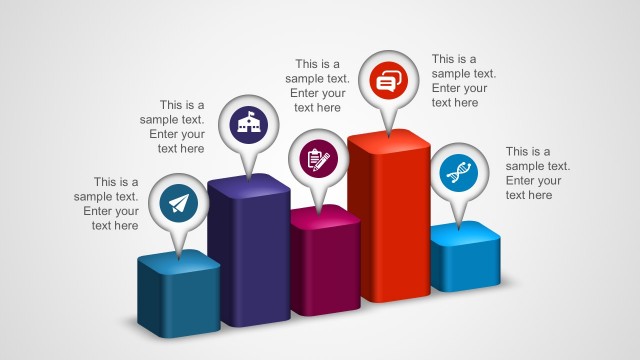
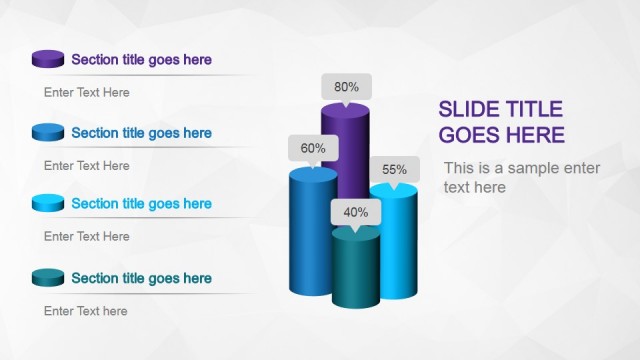
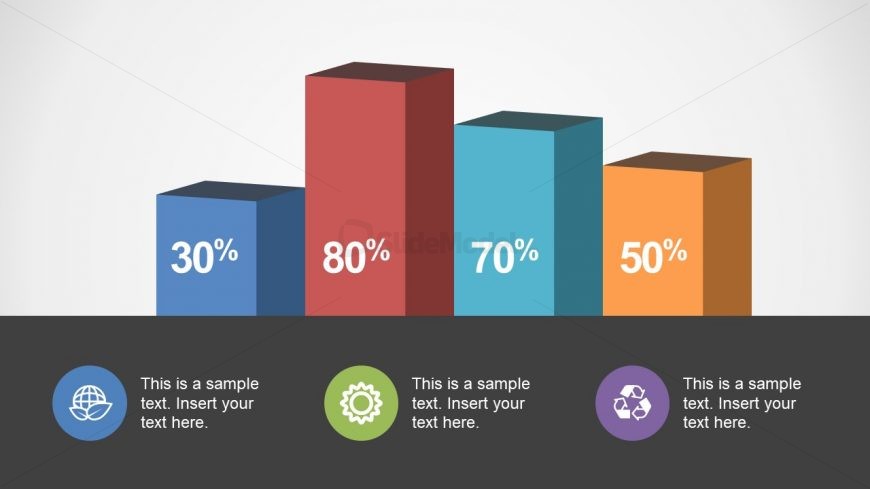
The slide features a horizontal arrangement of four vertical bar charts, each representing a percentage value. The bars are colored differently: blue, red, teal, and orange, with the tallest bar on the right. Below each bar, there are circular icons in corresponding colors, each accompanied by a text placeholder aligned centrally beneath. The background is a light gradient, while the lower section has a dark gray band that contains the text placeholders. The overall layout emphasizes the bars and their associated icons, creating a clear visual hierarchy.
How to Use It
This layout serves as a comparison chart, effectively showcasing data through bar graphs. It fits well in a presentation sequence after introducing key metrics or performance indicators. Ideal for business scenarios such as quarterly reports, project status updates, or strategic planning sessions, it allows for quick visual insights into comparative data. The layout can be used individually to highlight specific metrics or performance measures in a concise manner.
Text Placeholders & Capacity
Keep your copy within these limits so it fits without resizing. Node body slots can hold roughly 30 characters each.
| Placeholder | Count | Max characters (approx.) |
|---|---|---|
| Item body | 4 | 30 |
| Item heading | 4 | 5 |
Slide Keywords
Download unlimited PowerPoint templates, charts and graphics for your presentations with our annual plan.
DOWNLOADReturn to Free Business Slides for PowerPoint.