Slide 10 of 19 from Free Blue Business Corporate Slide Deck
Spike Data Drive Corporate Template
Data & Charts Slide for Business Presentations
- Chart
- Area Chart
- Data Analysis Slide
- 16:9
- 100% Editable
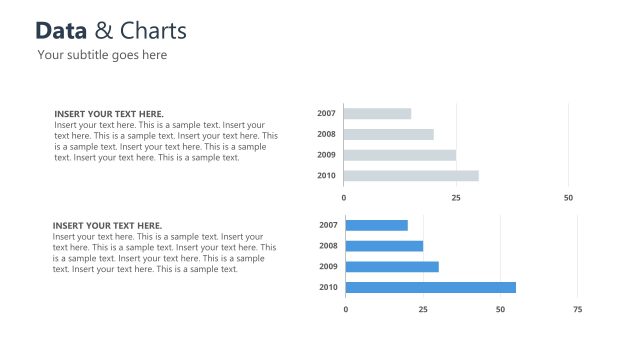
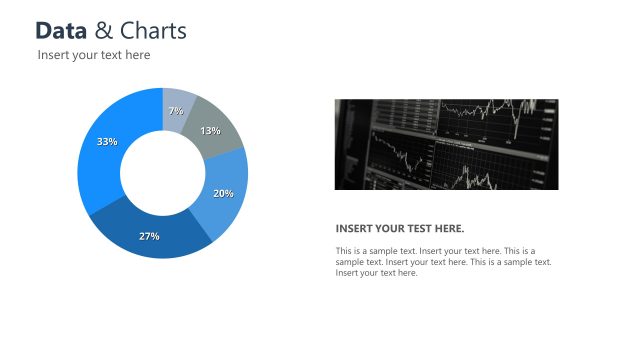
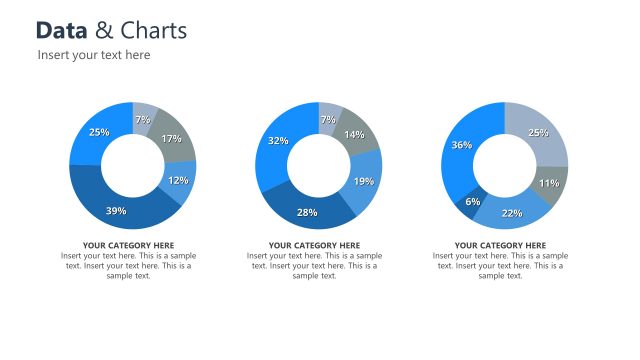
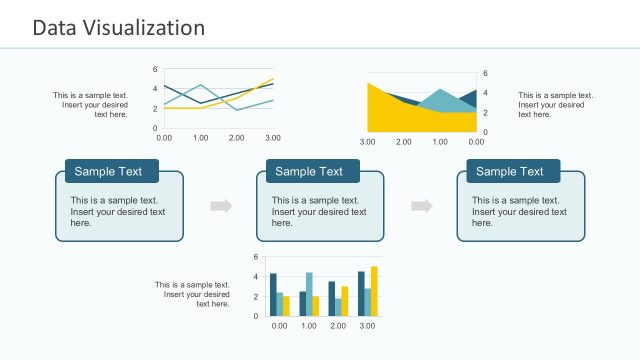
The Data & Charts slide from the Free Blue Business Corporate Slide Deck offers a clear and balanced layout for visualizing sales performance and market trends. Designed with editable shapes and a central area chart, this slide template supports detailed data analysis in business presentations and pitch decks, enhancing clarity through ample white space and structured text placeholders.
What’s on This Slide
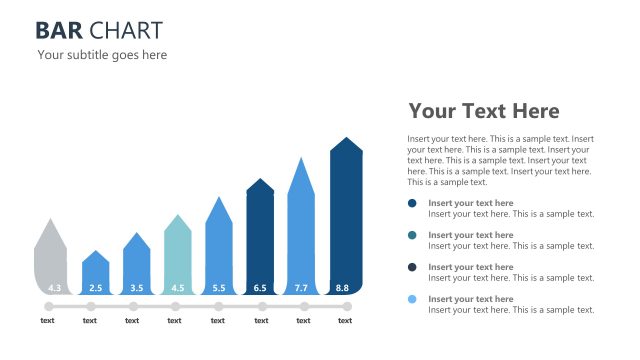
The layout features a central chart with five peaks, each labeled with numerical values. The peaks are filled with a light blue color, creating a wave-like appearance. Below the chart, there are text placeholders aligned centrally for additional descriptions. The title 'Data & Charts' is positioned at the top left, with a larger font size, while a secondary placeholder for a title is located to the right. The overall composition is balanced, with ample white space surrounding the elements, enhancing readability and focus on the chart.
How to Use It
This layout serves as a data visualization tool, ideal for presenting statistical information or trends. It fits well in a presentation sequence after introducing a problem or context, transitioning into detailed analysis. This structure is useful for business scenarios such as sales performance reviews, market analysis, or project updates, where visual data representation is essential for clarity and impact.
Text Placeholders & Capacity
Keep your copy within these limits so it fits without resizing. Body slots can accommodate around 100 characters each.
| Placeholder | Count | Max characters (approx.) |
|---|---|---|
| Slide title | 1 | 30 |
| Item heading | 5 | 2 |
| Item body | 5 | 100 |
| Body paragraph | 7 | 150 |
Slide Keywords
Download unlimited PowerPoint templates, charts and graphics for your presentations with our annual plan.
DOWNLOADReturn to Free Blue Business Corporate Slide Deck.