Slide 11 of 19 from Free Blue Business Corporate Slide Deck
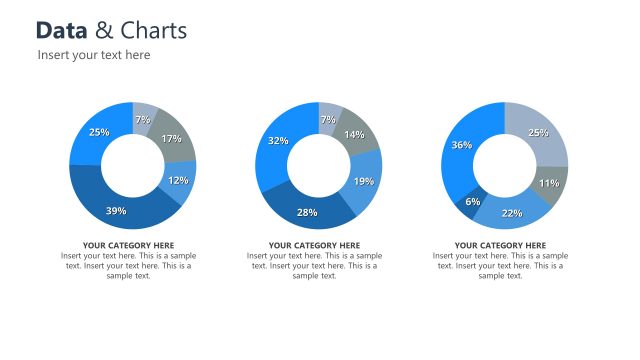
Blue Data Donut Chart for Corporate
Data and Charts Presentation Slide
- Chart
- Donut Chart
- Data Analysis Slide
- 16:9
- 100% Editable
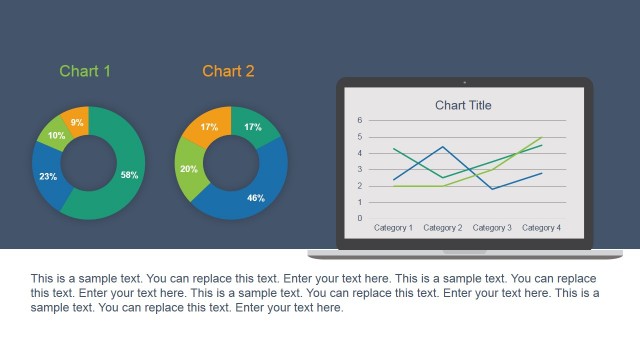
The Data and Charts Layout from the Free Blue Business Corporate Slide Deck offers a clear visual presentation of quantitative data using a donut chart alongside a financial graph image. This slide template is designed for business reports and marketing presentations, combining editable shapes and text placeholders to support detailed data analysis within a corporate presentation or pitch deck template.
What’s on This Slide
The slide features a donut chart positioned on the left side, displaying segments with percentages labeled inside. The chart is predominantly blue, with varying shades for each segment. On the right side, there is a rectangular image placeholder showing a financial graph. Below the image, there is a large text placeholder for additional content, aligned left. The overall layout is divided into two main sections, with the chart and image clearly separated, creating a balanced composition. The background is white, enhancing the visibility of the elements.
How to Use It
This layout serves to present data visually alongside textual explanations. It fits well in a presentation sequence after introducing a topic and before discussing detailed findings. Ideal for business reports, marketing analysis, or financial summaries, it allows for clear communication of quantitative information. The donut chart effectively visualizes proportions, while the accompanying text provides context or insights, making it suitable for data-driven discussions.
Text Placeholders & Capacity
Keep your copy within these limits so it fits without resizing. Body slots can accommodate approximately 40-50 words each.
| Placeholder | Count | Max characters (approx.) |
|---|---|---|
| Slide title | 1 | 30 |
| Body paragraph | 1 | 300 |
| Item heading | 7 | 5 |
Slide Keywords
Download unlimited PowerPoint templates, charts and graphics for your presentations with our annual plan.
DOWNLOADReturn to Free Blue Business Corporate Slide Deck.