Slide 9 of 19 from Free Blue Business Corporate Slide Deck
Data Driven Customer Corporate PowerPoint
Data & Charts Visualization Slide
- Chart
- Area Chart
- Data Findings Slide
- 16:9
- 100% Editable
What’s on This Slide
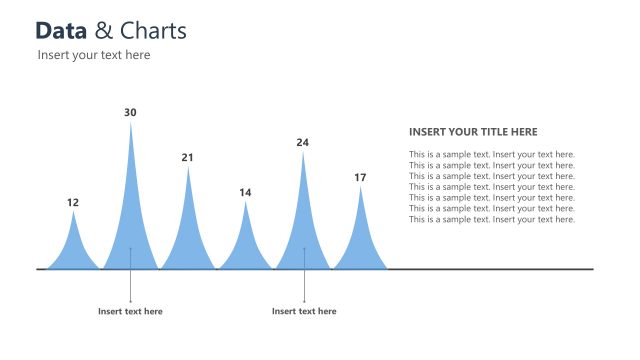
The layout features a large area for a chart, positioned centrally, with a title at the top left. The chart consists of multiple peaks represented by light blue shapes, indicating data values. Each peak is labeled with a numerical value, ranging from 12 to 30. The background is predominantly white, providing contrast to the blue chart elements. There is a text placeholder at the top right for additional information, maintaining a clear visual hierarchy. The overall composition is balanced, emphasizing the chart as the focal point.
How to Use It
This layout serves as a data visualization slide, ideal for presenting trends or comparisons using charts. It fits well in a presentation sequence after introducing key concepts or data points. This structure is useful in business contexts such as quarterly reports, performance reviews, or market analysis, where visual data representation is essential for clarity. It allows for straightforward communication of numerical information, making it suitable for various analytical discussions.
Text Placeholders & Capacity
Keep your copy within these limits so it fits without resizing. Body slots can hold around 15-20 words each.
| Placeholder | Count | Max characters (approx.) |
|---|---|---|
| Slide title | 1 | 30 |
| Body paragraph | 1 | 100 |
| Data label | 7 | 2 |
Slide Keywords
Download unlimited PowerPoint templates, charts and graphics for your presentations with our annual plan.
DOWNLOADReturn to Free Blue Business Corporate Slide Deck.