Slide 4 of 8 from Free Animated Business Infographics PowerPoint Template
Cool Infographics for Business Presentation
People Comparison Infographic Slide
- Chart
- Other
- Comparison Slide
- 16:9
- 100% Editable
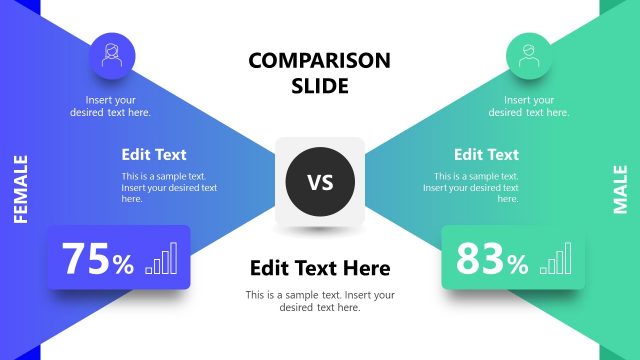
The People Comparison Chart slide from the Free Animated Business Infographics PowerPoint Template offers a clear visual format for demographic analysis and gender comparison. This slide layout uses editable shapes and vector icons to represent workforce statistics effectively, making it a practical choice for business presentations and market research slide decks.
What’s on This Slide
The layout features two circular charts on the left and right, representing the number of men and women, respectively. The left circle displays the number '4,258' with a male icon, while the right circle shows '3,725' with a female icon. A prominent number '03' is positioned centrally, indicating the slide's sequence. Below each circle, there are two text placeholders aligned vertically for additional information. The background consists of a light gray color with vibrant green and blue accents, enhancing visual contrast and hierarchy. The overall composition is balanced with clear groupings of related elements.
How to Use It
This layout serves as a comparison chart, effectively illustrating demographic data between two groups. It fits well in a presentation sequence after a problem slide, providing a visual representation of gender statistics. This format is useful in business scenarios such as market analysis, demographic studies, or presentations focused on gender diversity. It allows for quick visual insights into comparative data, making it suitable for reports or discussions on workforce composition or customer demographics.
Text Placeholders & Capacity
Keep your copy within these limits so it fits without resizing. Node labels and bodies are tight, roughly 30 characters each.
| Placeholder | Count | Max characters (approx.) |
|---|---|---|
| Item body | 2 | 30 |
| Item heading | 2 | 30 |
| Slide title | 1 | 20 |
| Callout | 1 | 5 |
Slide Keywords
Download unlimited PowerPoint templates, charts and graphics for your presentations with our annual plan.
DOWNLOADReturn to Free Animated Business Infographics PowerPoint Template.