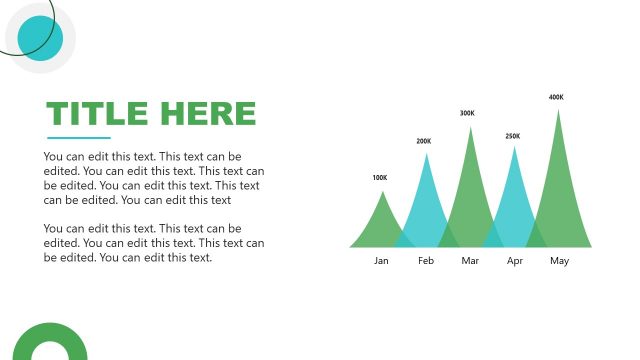
Slide 3 of 9 from Free Animated Editable Professional Infographics PowerPoint Template
Data Drive Area Chart PPT
Monthly Performance Chart for Business Insights
- Chart
- Line Chart
- Evaluation Slide
- 16:9
- 100% Editable
The Monthly Performance Chart slide from the Free Animated Editable Professional Infographics PowerPoint Template offers a clear visualization of sales trends and monthly data through a line chart with editable shapes and vector icons. This slide layout supports business presentations and pitch deck templates by enabling detailed monthly performance reviews and data-driven storytelling.
What’s on This Slide
The layout features a line chart in the center with a grid background. The chart displays a series of peaks and valleys representing monthly data points from January to December. Above each peak, there are diamond-shaped markers for additional text placeholders. On the left side, a large circular number '01' is prominently displayed. At the bottom left and right, there are circular icons with text placeholders for supplementary information. The color scheme includes teal, yellow, and blue gradients, creating a visually distinct hierarchy.
How to Use It
This layout functions as a performance chart, ideal for presenting monthly data trends in a business context. It fits well in a sequence after an introductory slide, providing a visual representation of key metrics. Use this structure to highlight growth, sales performance, or other time-series data. It is suitable for quarterly reviews, annual reports, or strategic planning sessions, where visual data storytelling is essential.
Text Placeholders & Capacity
Keep your copy within these limits so it fits without resizing. Body slots are tight, roughly 5-6 words each.
| Placeholder | Count | Max characters (approx.) |
|---|---|---|
| Item heading | 12 | 10 |
| Slide title | 1 | 20 |
| Body paragraph | 3 | 30 |
Slide Keywords
Download unlimited PowerPoint templates, charts and graphics for your presentations with our annual plan.
DOWNLOADReturn to Free Animated Editable Professional Infographics PowerPoint Template.