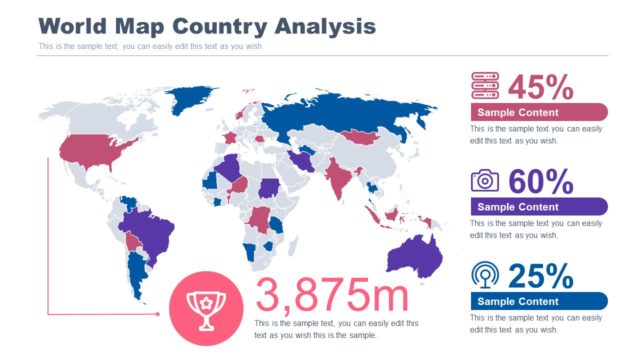
Slide 11 of 32 from #2 Editable Data Driven Maps Bundle
Globe User Analysis PowerPoint Map Template
Globe User Analysis Slide
- Diagram
- Other
- Strategic Analysis Slide
- 16:9
- 100% Editable
The Globe User Analysis slide from the #2 Editable Data Driven Maps Bundle offers a clear visual layout for presenting demographic insights and user engagement data. This slide template includes editable shapes and vector icons that help illustrate market research findings effectively, making it suitable for business presentations and corporate slide decks focused on strategic analysis.
What’s on This Slide
The slide features a globe graphic positioned centrally, with a large numerical value of 685k displayed prominently in the center. Two human icons are placed above the number, indicating demographic data. To the right, three circular icons are aligned vertically, each accompanied by sample text placeholders for titles and descriptions. The first icon is a location marker, the second is a microphone, and the third is a shirt icon. Each icon has a distinct color, contributing to a cohesive color scheme. Text placeholders are aligned to the right of the icons, maintaining a clear visual hierarchy.
How to Use It
This layout serves as a user analysis overview, effectively summarizing demographic data and user characteristics. It fits well in a presentation sequence following a problem statement or market analysis, providing insights into user engagement or behavior. This structure is suitable for business scenarios such as market research presentations, user experience reports, or demographic studies, where visual representation of data enhances understanding and retention.
Text Placeholders & Capacity
Keep your copy within these limits so it fits without resizing. Body slots can accommodate roughly 30 words each.
| Placeholder | Count | Max characters (approx.) |
|---|---|---|
| Slide title | 1 | 30 |
| Body paragraph | 4 | 150 |
Slide Keywords
Download unlimited PowerPoint templates, charts and graphics for your presentations with our annual plan.
DOWNLOADReturn to #2 Editable Data Driven Maps Bundle.