Slide 10 of 32 from #2 Editable Data Driven Maps Bundle
Global Analysis World Global Map Template
Globe Analysis Slide for Data Presentation
- Diagram
- Other
- Context Slide
- 16:9
- 100% Editable
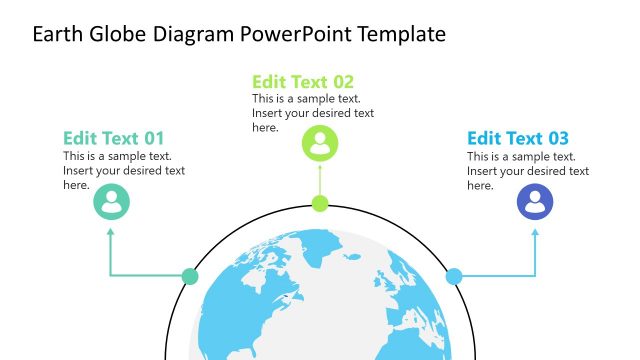
The Globe Analysis slide from the #2 Editable Data Driven Maps Bundle offers a structured layout for presenting geographic data and market analysis. Featuring a central globe illustration with connected nodes, this slide template supports clear visualization of demographic insights and global trends. It is designed as part of a business presentation or educational content, providing editable shapes and placeholders to customize key geographic information effectively within a professional slide deck.
What’s on This Slide
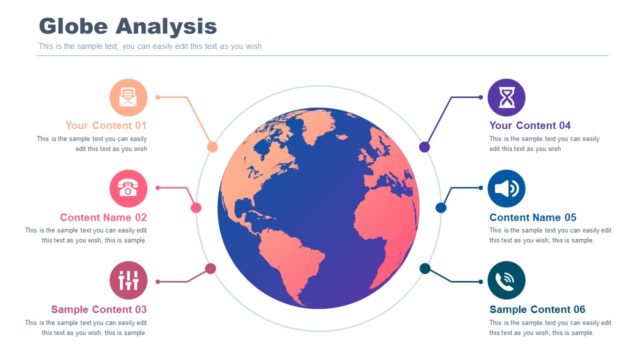
The slide features a central globe illustration, colored in blue and orange, representing continents. Surrounding the globe are six circular nodes, each connected by lines. The nodes are positioned at the top, bottom, left, and right, with varying colors and icons. Each node contains a text placeholder for titles and descriptions, aligned centrally within the circles. The title 'Globe Analysis' is prominently displayed at the top, with a subtitle placeholder below it. The overall layout is balanced, with a clear visual hierarchy emphasizing the globe and the nodes.
How to Use It
This layout serves as a visual overview of geographic data or analysis, ideal for presenting key insights related to global trends. It fits well in a presentation sequence following introductory content or problem framing slides. Use this structure to highlight different aspects of a geographic study, such as demographic data or market analysis, making it suitable for business reports or educational purposes.
Text Placeholders & Capacity
Keep your copy within these limits so it fits without resizing. Body slots can hold around 15-20 words each.
| Placeholder | Count | Max characters (approx.) |
|---|---|---|
| Slide title | 1 | 30 |
| Body paragraph | 6 | 80 |
Slide Keywords
Download unlimited PowerPoint templates, charts and graphics for your presentations with our annual plan.
DOWNLOADReturn to #2 Editable Data Driven Maps Bundle.