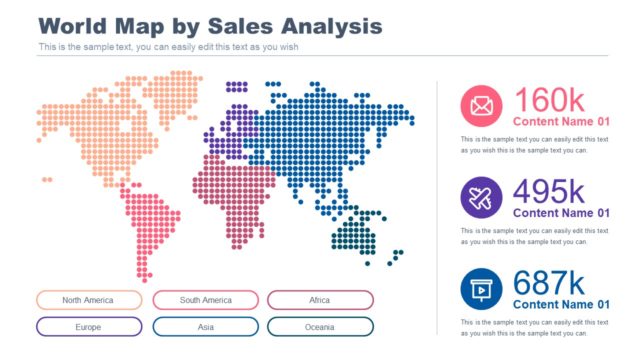
Slide 9 of 29 from #2 Maps Bundle PowerPoint Template
30011-01-maps-bundle-powerpoint-8
Globe Analysis Slide for Presentations
- Diagram
- Other
- Context Slide
- 16:9
- 100% Editable
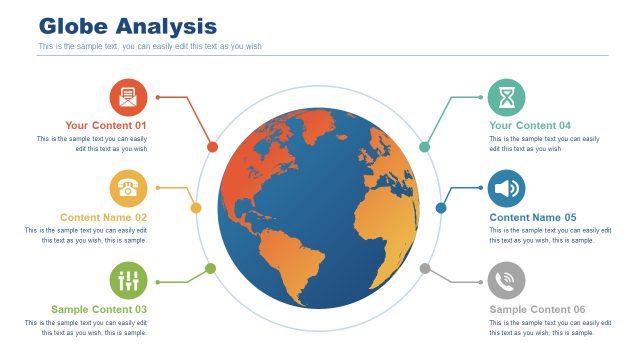
The Globe Analysis slide from the #2 Maps Bundle PowerPoint Template provides a clear visual framework for presenting geographic trends and market analysis. Featuring a central globe graphic connected to multiple nodes, this layout supports detailed demographic studies and regional insights. It is designed as an editable slide within a business presentation or pitch deck template, allowing users to customize text and colors to suit their corporate presentation needs.
What’s on This Slide
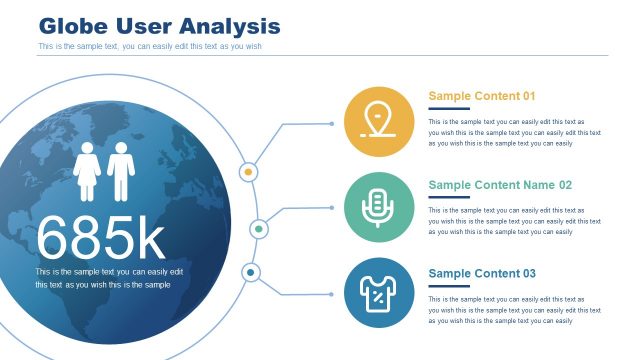
The slide features a central globe graphic, colored in shades of blue and pink, representing geographical data. Surrounding the globe are six circular nodes, each containing text placeholders aligned to the left and right. The nodes are connected to the globe with thin lines, indicating relationships. The title is positioned at the top center, with a subtitle below it. Each node includes a title and a body text placeholder, with varying colors for differentiation. The overall layout is circular, emphasizing the globe as the focal point.
How to Use It
This layout serves as a visual representation of geographical data analysis, suitable for presentations discussing global trends or market insights. It fits well after a problem-framing slide, leading into a detailed analysis. This structure is effective for business scenarios such as market entry strategies, regional performance reviews, or demographic studies, allowing for clear communication of complex information through visual means.
Text Placeholders & Capacity
Keep your copy within these limits so it fits without resizing. Node body slots can accommodate roughly 15-20 words each.
| Placeholder | Count | Max characters (approx.) |
|---|---|---|
| Slide title | 1 | 30 |
| Subtitle | 1 | 100 |
| Item heading | 6 | 30 |
| Item body | 6 | 100 |
Slide Keywords
Download unlimited PowerPoint templates, charts and graphics for your presentations with our annual plan.
DOWNLOADReturn to #2 Maps Bundle PowerPoint Template.