The financial projection slide is one of the most scrutinized parts of any investor pitch. While product features, milestones, or market insights may spark curiosity, the financial projection slide grounds the discussion in hard numbers, providing a solid foundation for the debate. Investors expect to see not just vision but a financially coherent story. This slide illustrates how the business model generates revenue, outlines expected costs, and explains how profitability can be achieved over time.
When delivered effectively, the financial projection slide reassures investors that the business owners understand the mechanics of scaling, the realities of cash flow, and risk management. For presenters, this slide can be intimidating because it opens the door to detailed questioning. Yet, it is also the best opportunity to showcase command of the business and demonstrate that funding requests are tied to achievable outcomes.
This article explains how to construct and present a financial projection slide that earns investor trust.
Table of Contents
- Why is the Financial Projection Slide Important During Investor Meetings
- Financial Projection Slide vs Financial Deck
- Why Should You List a Financial Projection Slide in a Slide Deck
- What to Include in a Financial Projection Slide
- Which PowerPoint Graphics Work for Financial Projections
- Mistakes to Avoid When Building the Financial Projection Slide
- FAQs
- Final Words
Why is the Financial Projection Slide Important During Investor Meetings
From an investor’s standpoint, financial projections are not predictions of the future. Instead, they serve as a test of logic, discipline, and market awareness. A founder who can explain how projected revenue connects to user growth, sales funnels, and operating costs demonstrates an understanding of the key levers of their business.
Projections also create a framework for evaluating investment risk. The numbers on this slide serve as a proxy for management quality. If the projections are coherent and tie back to validated assumptions, investors see a team capable of planning. Otherwise, if your numbers seem unrealistic or disconnected from the market context, confidence diminishes.
When presenting financial projections, the goal is not to convince investors that every figure will happen as stated. Instead, the goal is to demonstrate that the team has a structured approach to thinking about growth, understands its cost base, and can model various scenarios. For example, revenue targets tied to specific customer acquisition channels show a clear understanding of sales dynamics. Expense forecasts aligned with planned hires demonstrate awareness of organizational scaling. It’s a way to prove credibility.
Most importantly, projections provide the context for the funding request. If the company is raising $2 million, investors want to see how that capital supports the projected growth. Without numbers, the ask feels arbitrary. With projections, the discussion becomes concrete: capital will extend the runway for 18 months, during which the company will reach defined revenue milestones.
Financial Projection Slide vs Financial Deck
Presenters often confuse the financial projection slide with the broader financial deck, but they serve different purposes. The financial projection slide is a condensed snapshot included in the pitch deck. Its role is to give investors a quick, high-level view of expected revenue, costs, and profitability over the next three to five years. It is designed for live presentation: numbers must be simple enough to absorb in seconds, while still supporting the growth story. The focus is clarity, not detail.
By contrast, the financial deck, or full financial presentation, is a separate, detailed document usually shared during due diligence. It includes granular assumptions about pricing, customer acquisition, churn, marketing spend, headcount, and operating costs. Often built in Excel or Google Sheets, the financial deck allows investors to stress-test scenarios, evaluate sensitivity to key assumptions, and check whether the company’s growth plan is internally consistent.
Why Should You List a Financial Projection Slide in a Slide Deck
Including a financial projection slide signals preparedness. It tells investors that the team is not only excited about the product but also attentive to financial realities. Leaving projections out can raise suspicion. Investors may assume the company executives either lack a financial model or are reluctant to show it.
The slide does not need to be overloaded with detail. The purpose is to distill the broader financial model into a format that fits on a single screen. Typical horizons are three to five years, depending on the company’s stage. Early-stage startups typically project a three-year timeline, while later-stage ones may project a five-year timeline. The critical points to highlight are revenue, gross margin, operating expenses, and net income.
Beyond numbers, the projection slide communicates intent. A company projecting steady growth with moderate expenses signals cautious planning. A company showing aggressive expansion with rapid scaling costs signals a different strategy. Either approach can be valid, but the projections must align with the narrative of the pitch.
For presenters, this slide sets the tone for the Q&A. Investors will scrutinize assumptions, ask how figures were derived, and assess the founder’s understanding of unit economics. A clear slide makes this process smoother. It shows the team is transparent and ready to engage in constructive dialogue.
What to Include in a Financial Projection Slide
The financial pitch deck is not a financial statement. It is a condensed visualization of the company’s growth expectations. To be effective, it should include:
Revenue Forecast
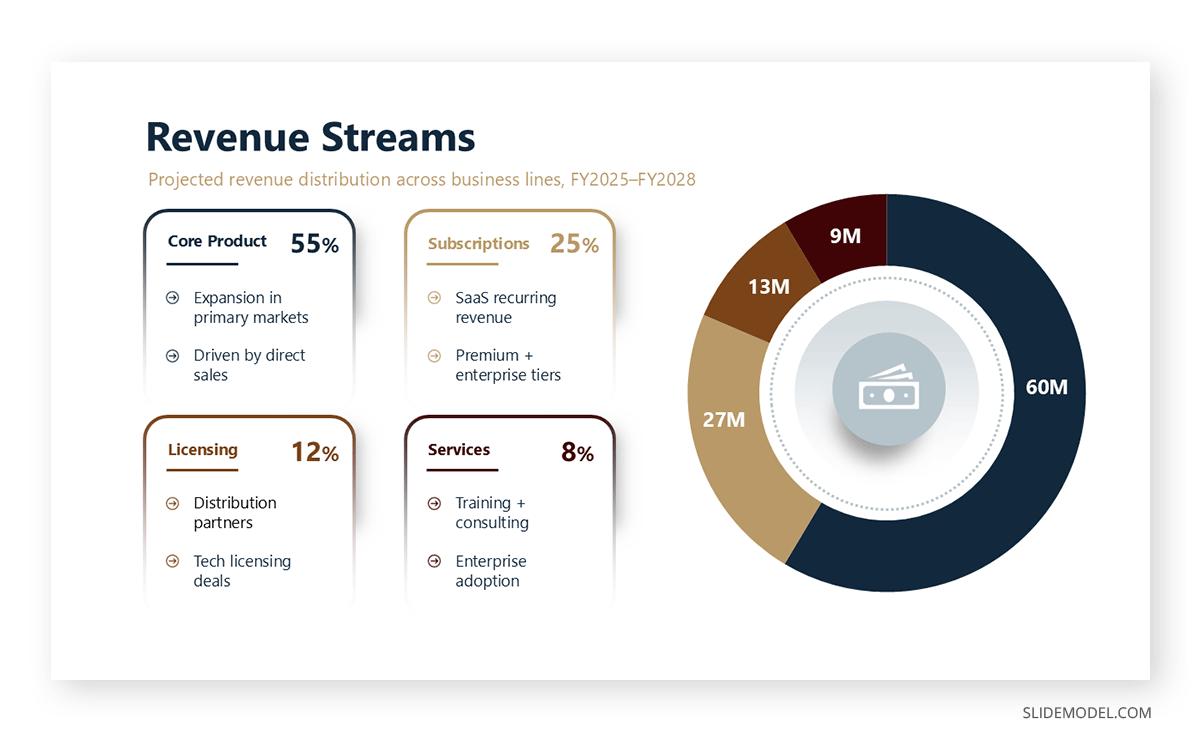
Revenue is the centerpiece. Investors want to see how sales are expected to grow over time. This can be broken down by product lines, customer segments, or geographic markets, as applicable. For early-stage startups, the revenue model should be tied to specific assumptions, such as the number of users acquired, average spend per customer, or conversion rates.
Gross Margin
Gross margin shows the efficiency of production or service delivery. Including it signals that the team understands the cost of goods sold and how profitability scales with volume. Margins also allow investors to benchmark the company against industry standards.
Recommended lecture: Financial Statements Presentation
Operating Expenses
Projecting operating costs is critical. Salaries, marketing expenses, product development costs, and administrative fees should be reflected. The level of detail depends on the stage; however, omitting expenses can make projections appear unrealistic. Expenses should align with planned milestones, such as expanding the team or entering a new market.
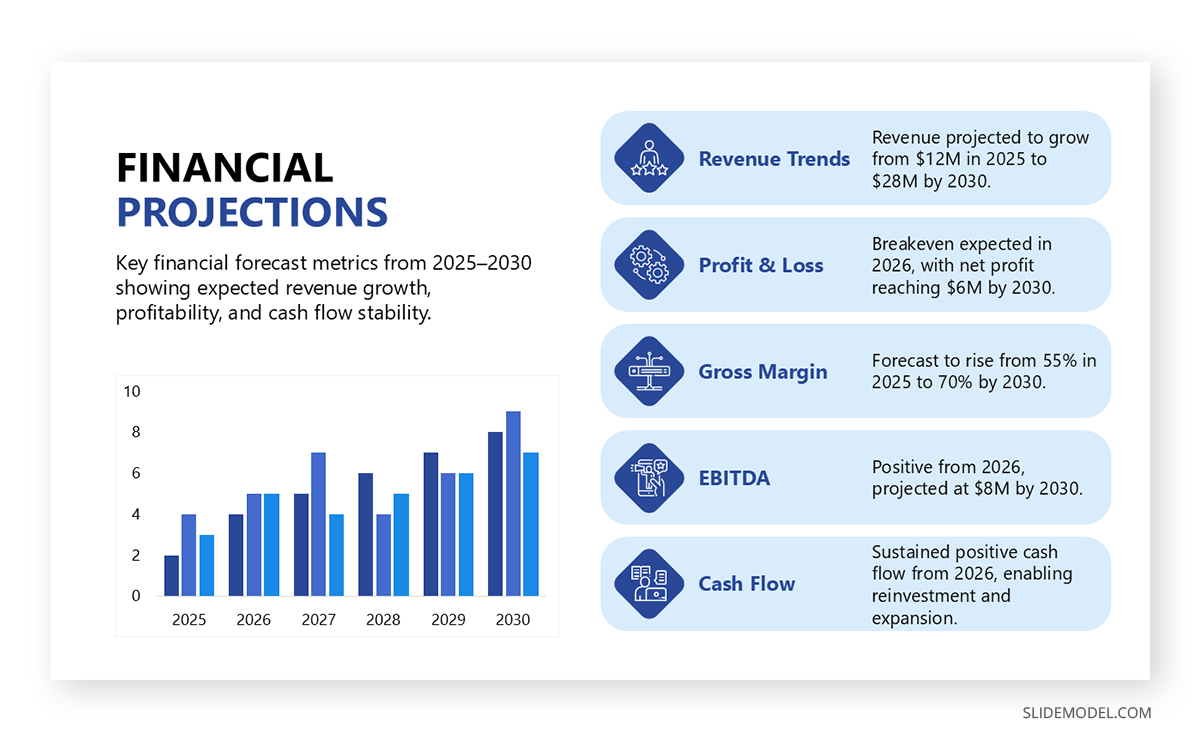
EBITDA or Net Income
Including earnings before interest, taxes, depreciation, and amortization (EBITDA) or net income shows the bottom-line trajectory. Few investors expect early-stage startups to be profitable immediately, but they want to see a path to profitability within a reasonable timeframe.
Funding and Runway Context
Link the projections directly to the raise. Demonstrate how the requested funds will extend the runway and enable the projected growth. This connection reassures investors that the ask is grounded in numbers.
Time Horizon
Most slides display projections across years, typically from Year 1 to Year 3 or from Year 1 to Year 5. Each column should represent a full year. Avoid monthly or quarterly breakdowns unless specifically requested.
For presenters, the challenge is striking a balance between clarity and simplicity. Too little information appears evasive, while too much detail overwhelms the audience. The slide should serve as an entry point into a deeper discussion, rather than providing an exhaustive financial statement.
Which PowerPoint Graphics Work for Financial Projections
Clarity is the top priority when designing financial projection slides. Investors need to quickly grasp key figures without being distracted by excessive visuals.
Tables with Key Metrics
A simple table PPT template is often the most straightforward way to present projections. Columns can represent years, and rows can show revenue, gross margin, expenses, and net income. Formatting should highlight the most important numbers.
Bar Charts
Bar charts help show revenue growth over time. They provide visual reinforcement of the growth story and make trends easier to spot. Color coding can differentiate revenue streams.
Line Charts
Line charts are effective for cumulative metrics, such as total users or gross margin improvement. They help show momentum and scaling effects.
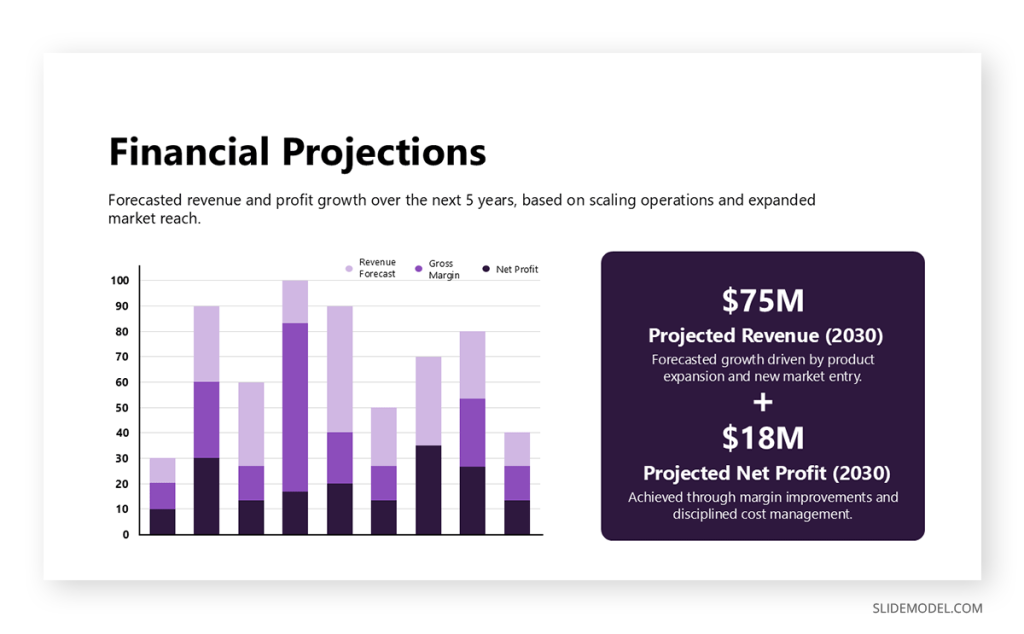
Hybrid Formats
Some decks combine a table with a supporting chart. The table provides exact numbers, while the chart visualizes the trend. This dual approach addresses both detail-oriented and visually driven investors. Ideally, we recommend implementing a dashboard slide template for this purpose.
Infographic Elements
PowerPoint icons or infographic PPT templates can clarify specific points, such as profitability, breakeven, or market entry years. These should be minimal and never overshadow the numbers.
Presenters should avoid overly complex designs. Fancy templates may look impressive, but they can reduce clarity. The design goal is comprehension, not decoration. Investors appreciate straightforward visuals that communicate quickly.
Mistakes to Avoid When Building the Financial Projection Slide
Overly Optimistic Projections
The most common mistake is presenting projections that lack realism. For example, showing revenue growth from zero to $100 million in three years without a clear justification will trigger skepticism. Investors see hundreds of decks and can quickly spot unrealistic numbers.
Ignoring Expenses
Another error is projecting revenue without matching expenses. High growth with minimal costs signals a lack of financial discipline. Investors want to see awareness of the cost base.
Overcrowding the Slide
Some entrepreneurs attempt to replicate their full financial model on one slide. This overwhelms the audience and makes the slide unreadable. The pitch deck is a summary, not an audit document.
Inconsistent Metrics
If the revenue forecast suggests scaling to 100,000 customers, but marketing expenses appear too low to acquire that many users, investors will question the assumptions. Numbers must align logically.
Neglecting Visual Hierarchy
If all figures are given equal weight, investors may struggle to identify the key message. The most important metrics should stand out through size, color, or placement.
Using Jargon or Technical Accounting Terms
High-level executives sometimes insert accounting terms that may not be familiar to all investors. The projection slide should use plain language, including terms such as revenue, costs, margin, and profit. More technical details can be reserved for supporting documents.
FAQs
What is the purpose of a financial projection slide in a pitch deck?
It summarizes expected financial performance, demonstrating how revenue, costs, and profit evolve. It enables investors to assess scalability and funding requirements.
How many years should financial projections cover?
Three years is standard for early-stage startups. Later-stage companies often provide five years. The key is to align with your funding horizon.
Should financial projections show profitability?
Not immediately, but they should show a path to profitability. Investors want evidence that the business can eventually generate positive cash flow.
Do financial projections need to match industry benchmarks?
They should be consistent with market norms. If margins or growth rates deviate significantly, be prepared to justify the reasons.
How detailed should the financial projections slide be?
The slide should summarize high-level numbers. Detailed assumptions and models should be kept in a separate financial file.
Should I include best-case and worst-case scenarios?
Not usually on the main deck. However, be prepared to discuss scenario planning during the Q&A session.
How do I handle uncertainty in projections?
Acknowledge that projections are estimates. Emphasize the logic behind your assumptions and how you are tracking indicators to make adjustments.
Final Words
A well-designed financial projection slide does not guarantee investment, but it creates the foundation for trust. It shows that entrepreneurs are not only dreaming about the future but have taken the effort to map it in numbers. That effort signals seriousness, competence, and respect for investor capital.
For presenters, this slide is an opportunity to shift the conversation from vision to execution. When crafted carefully, it validates the funding request, aligns expectations, and demonstrates professional rigor.