Presenting data is about statistics and trends and accounting for potential variability in the information. Error bars on a graph visually represent this variability, highlighting the confidence in a dataset. In this article, we will discuss error bars in PowerPoint, their purpose, and the process of adding, customizing, and removing them.
What Are Error Bars in PowerPoint?
Error bars are graphical representations of data variability in charts. They can help make charts more informative by showing measurement-related uncertainty and making it easier to interpret statistical information.
Why Use Error Bars in PowerPoint?
By incorporating error bars, presenters can ensure that the audience can correctly interpret the data’s accuracy and reliability within a PowerPoint presentation. Error bars serve multiple purposes, including:
- Enhancing data interpretation: Error bars can make it easier to understand variations in data.
- Supporting decision-making: Error bars provide insights that can influence strategic business decisions.
- Improving credibility: Presentations with well-structured error bars appear more professional and data-driven.
Different Types of Error Bars
There are different types of error bars, including:
- Standard Error: This is used to display the standard deviation of data points.
- Percentage Error: As the name suggests, Percentage Error shows error values as a percentage.
- Fixed Value Error: This version uses a fixed number to represent uncertainty.
How to Add Error Bars in PowerPoint
Customizing a Bar Chart with Error Bars
To demonstrate the process for adding error bars on a bar chart in PowerPoint, we will use the Business Plan PowerPoint Template, which is a part of the many feature-rich PowerPoint templates and Google Slides templates you can find at SlideModel.
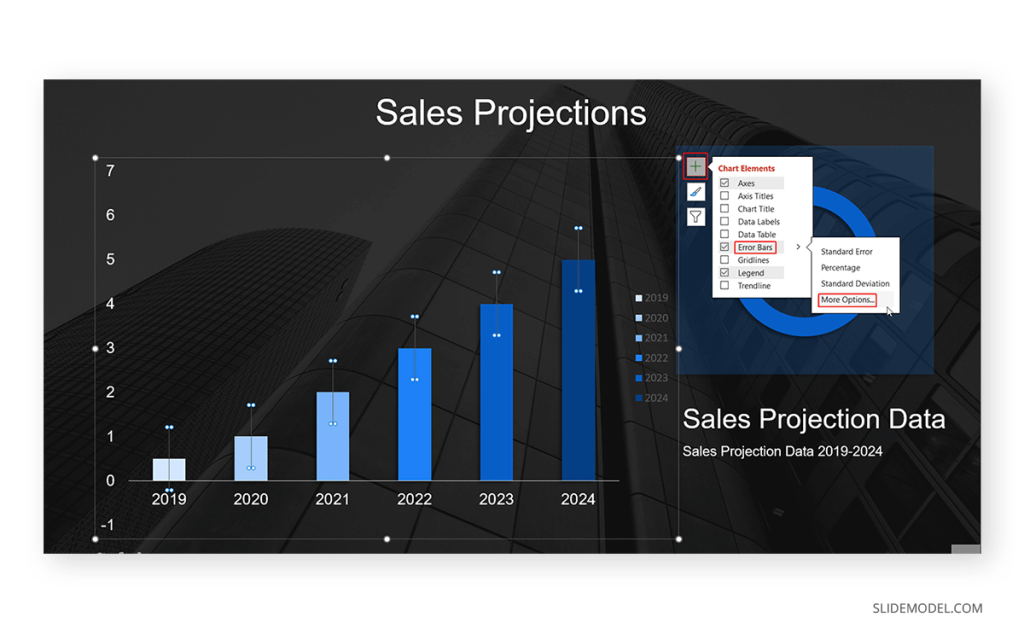
Step 1 – Enable Error Bars
Click the Chart Elements Button and the Plus icon (+) to reveal the menu and enable error bars on a chart. Select Error Bars from this menu.
Step 2 – Select Error Bar Type
The error bars will begin showing on the chart. Now, you can expand the Error Bars menu to choose the error bars needed. The options include Standard Error, Percentage Error, and Standard Deviation. To open the settings for adjusting error bars, select More Options.
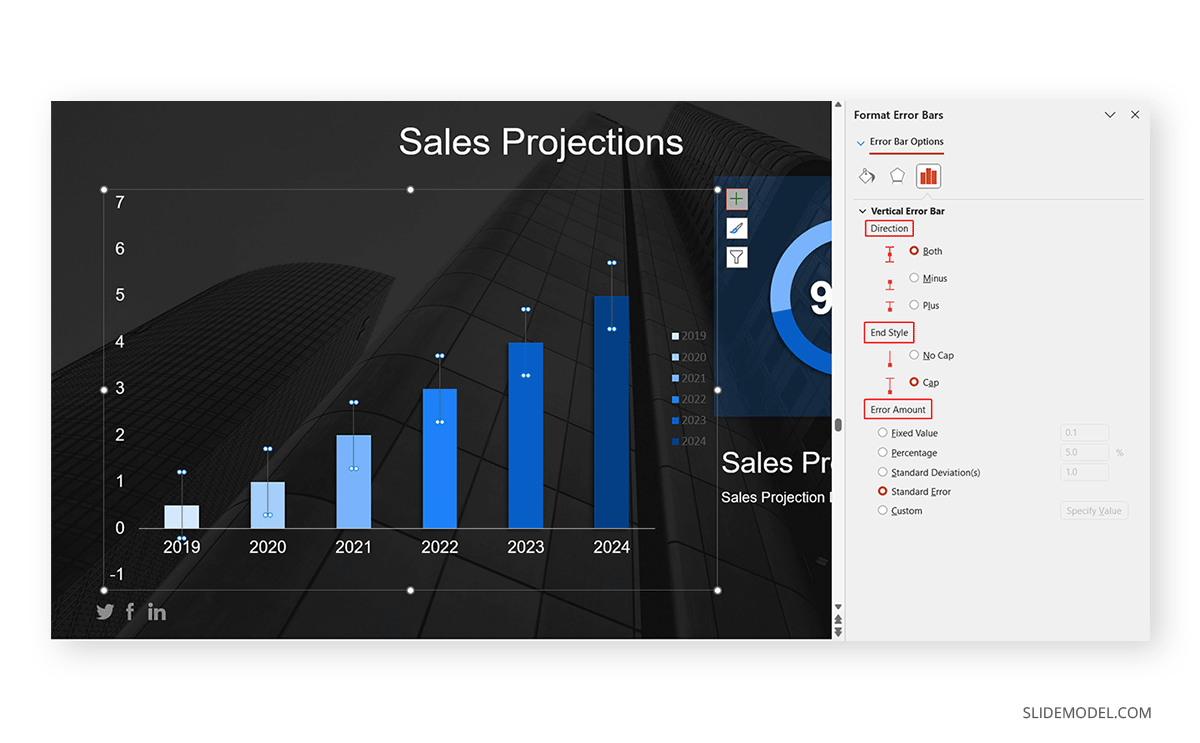
Step 3 – Adjust Error Bar Settings
Error bar settings via Plus Icon (+) -> Error Bars -> More options enable selecting the following:
- Direction: You can set the error bar direction to Plus, Minus, or Both Ways.
- End Style: You can choose a Cap or No Cap to select a style to present the error bars.
- Error Amount: This menu enables the adjustment of the error amount based on a fixed value, percentage, standard deviation (s), or custom value.
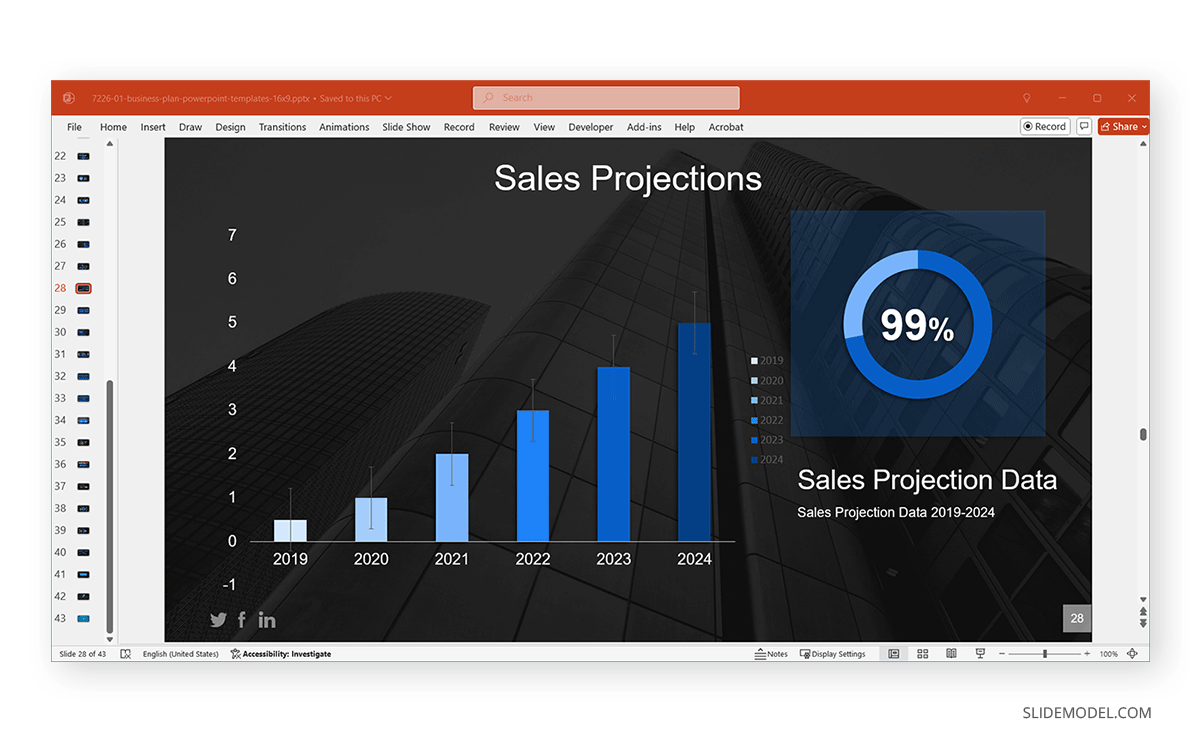
Note: Some chart types show a vertical error bar, whereas others, such as a scatter plot, will show both vertical and horizontal error bars.
The below example shows error bars enabled both ways for a standard bar chart with no cap.
Customizing a Line Chart with Error Bars
While error bars are commonly used across bar charts, another effective way to present error bars is through a line chart. To demonstrate this process, we will customize a line chart from the Support Team PowerPoint Dashboard Template. This template contains various charts and graphics to create a dashboard layout to design data-driven slides in a layout that makes use of both, instead of a single chart vs graph layout.
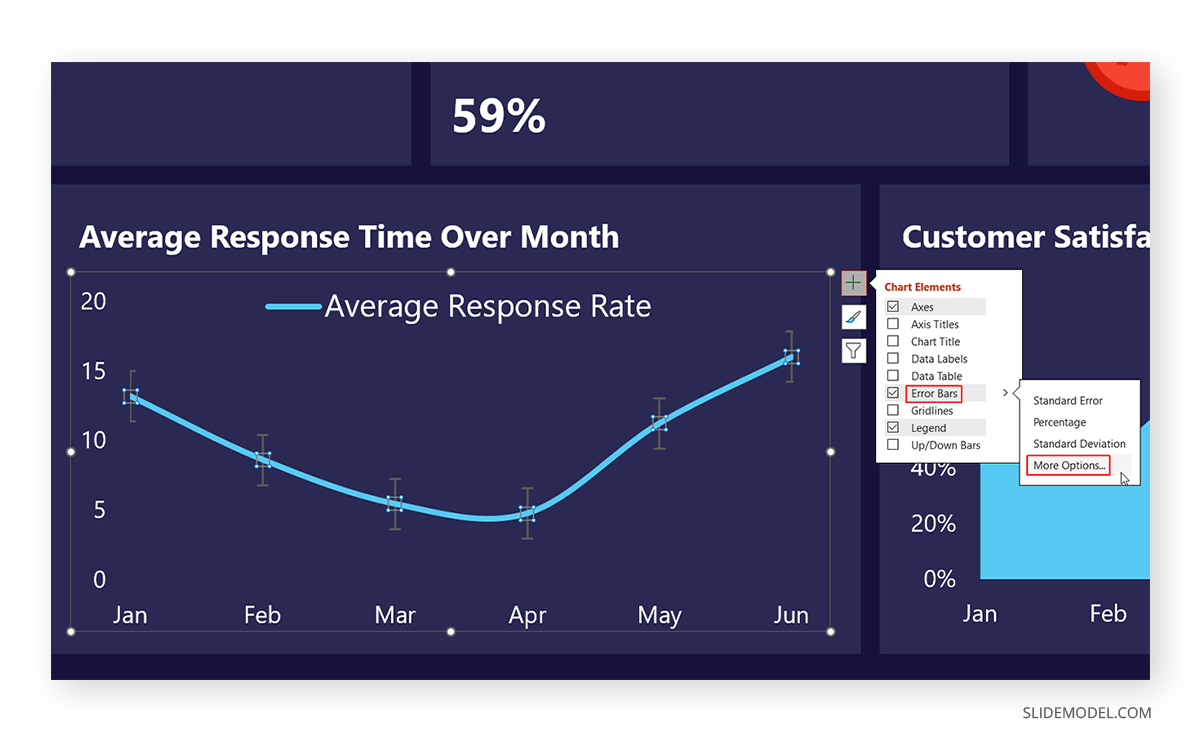
Step 1 – Enable Error Bars
You can enable and customize error bars the same way in a line chart like other charts. Simply click the Plus (+) icon and select Error Bars.
Step 2 – Select Error Bar Type
Select the type of error bar you want to pick from the expanded Error Bars menu or via More Options. The latter will also provide customization options to further adjust the chart.
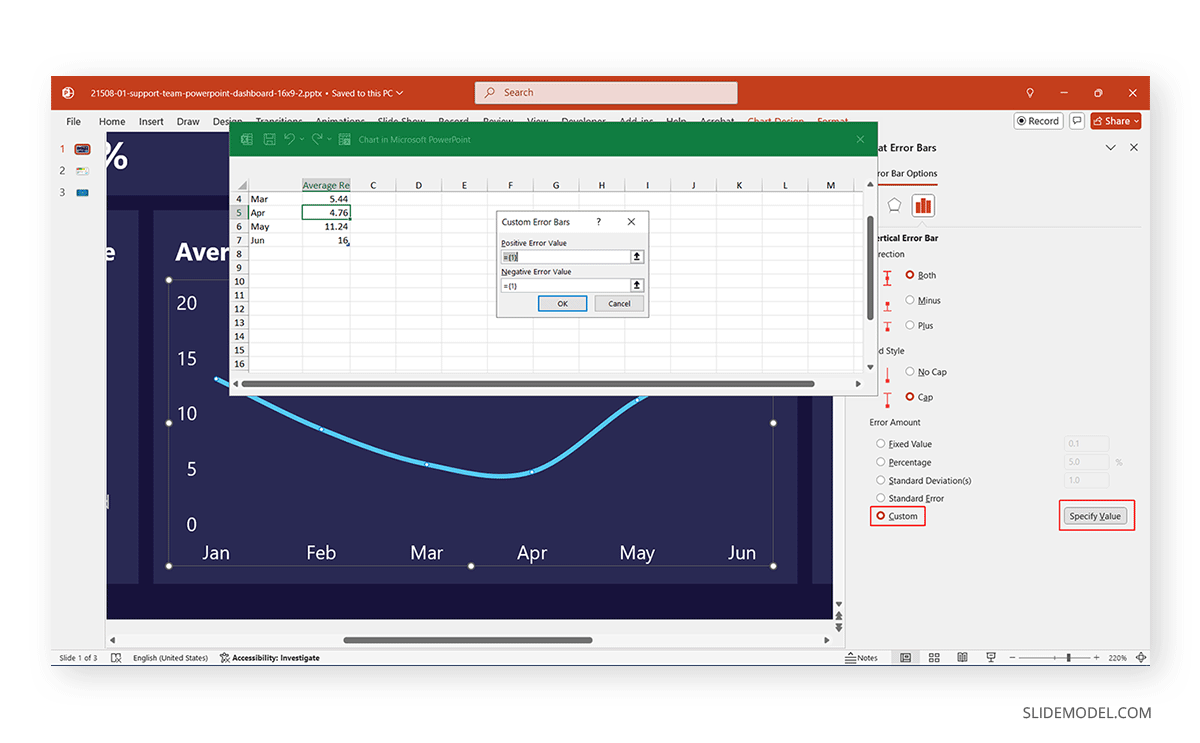
Step 3 – Adjust Line Chart Error Bars
You can adjust the line chart error bars by adding vertical error bars, end style, and error amount, similar to the process shown for the bar chart above. You can also use custom values to define your error bars on any chart type, be it a bar chart or line chart.
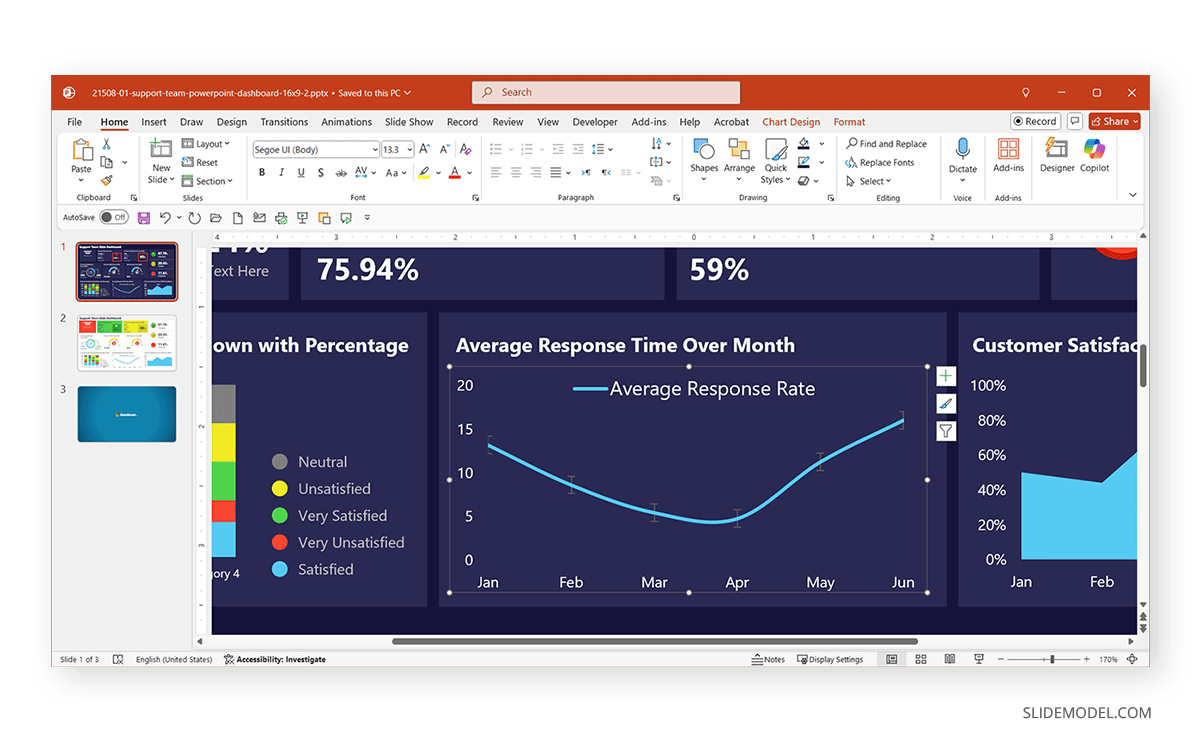
In the below example, we used standard deviation both ways with a cap for a line chart.
How to Remove Error Bars from a Chart
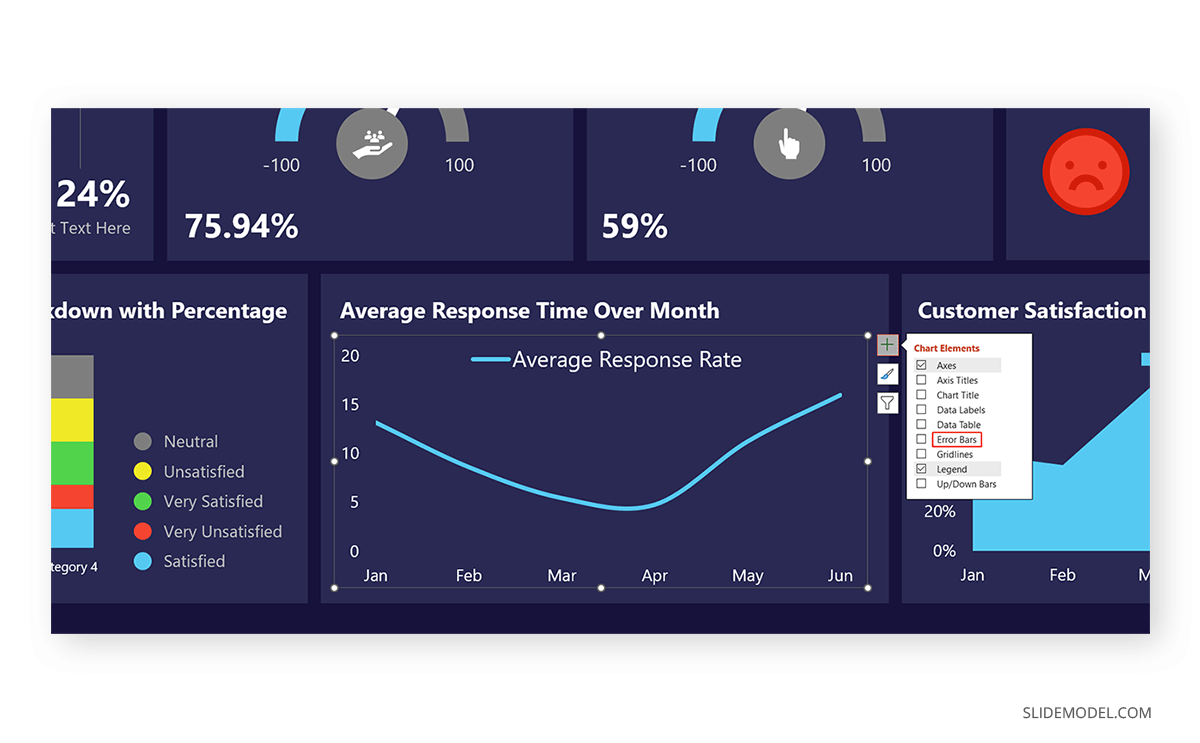
Removing error bars from a chart is easy. All you need to do is go to the Chart Elements button and uncheck the Error Bars option.
Step 1: Click the Chart Elements menu, which is the Plus icon (+) you see when you select the chart.
Step 2: Uncheck the Error Bars checkbox from the given menu.
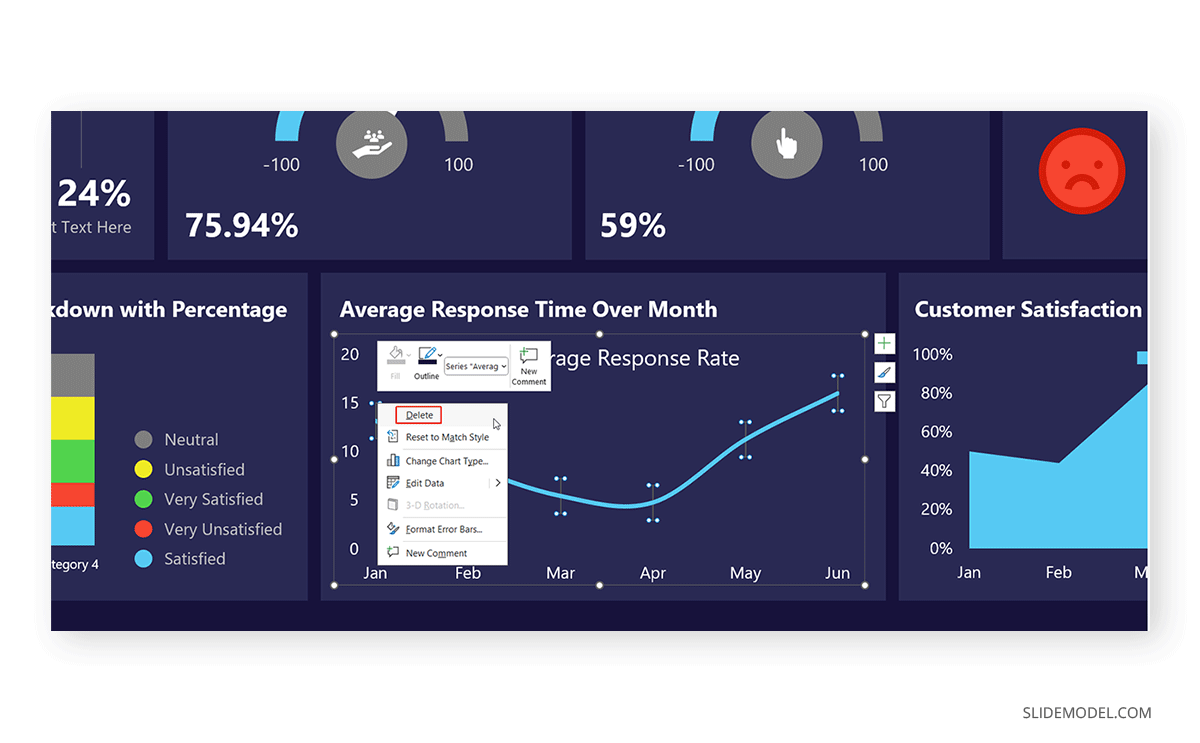
Alternative Method: Alternatively, right-click the error bars and select Delete via the right-click menu.
Best Practices for Using Error Bars in PowerPoint Presentations
To accurately present data, it is important to follow some basic guidelines to ensure that onscreen data is interpreted and presented correctly using error bars.
1. Keep Charts Simple
When using error bars, it is best to use simple charts to prevent visual clutter and overlapping data points. A cluttered visualization can confuse the audience and make the presenter’s explanation of data difficult. Stick to the most relevant data and limit the number of series to maintain clarity. When complex data needs to be presented, consider breaking it into multiple slides, separate charts, and interactive elements.
2. Use Appropriate Error Types
Error bars provide different error types. To ensure the accuracy of data, use the correct error charts. Different data sets require different error bars, such as standard error, percentage, or fixed value, and custom. The standard error can be useful for comparing mean values across groups, whereas percentage error bars are useful for showing relative variability in a dataset. Similarly, fixed value error bars are ideal for consistent measurement errors across all data points. Additionally, you can also use custom values to suit your needs. Understanding error types should be a key priority when using error bars when considering how to start a presentation and end a presentation with one or more charts.
3. Ensure Legibility
By ensuring that error bars have a reasonable size, thickness, and color, you can account for legibility. The default settings may not always be the most effective, so adjust them against the chart background and avoid using colors that blend with the slide background. Add a legend or annotate charts to explain error bars to the audience if necessary.
4. Maintain Consistency
Formatting consistency can help the audience remain focused on the data insights rather than deciphering different data styles. Use the same size, thickness, and color for error bars throughout your presentation to give it a professional look. Ensure that all charts follow the same formatting to maintain uniformity. This not only improves readability but also strengthens your presentation’s overall impact, allowing you to create an engaging presentation with your data sets.
5. Gauge the Utility of Error Bars
While it might be useful to use error bars, sometimes it might be best to avoid them. This is especially true if the audience is not adept at understanding or interpreting error bars and might require basic information related to the topic. In such a case, the utility of error bars might not be great and may cause confusion. When using error bars, it’s important to gauge the utility of using them, since there is a reason you are unlikely to find them in most presentations that contain charts.
Final Words
Whether you need to add, edit, customize, or remove error bars from charts, it is important to ensure that the key objective of presenting information is to make it easy enough to present and understand. Cluttered charts can be confusing, and error bars that overlap with other slide elements or blend into the background defeat the purpose of using them. It is also important to know which error type to use: fixed value, standard, percentage, or custom.
You can add error bars to PowerPoint charts from the Chart Elements menu. Some error bars come with a single type of direction, such as bar charts with only vertical error bars. On the contrary, other types of charts, such as scatter plots contain both vertical and horizontal directions for error bars. Error bars can be removed just like they are added, i.e., from the Error Bars option in the Chart Elements button, which is represented as a plus icon. Another method for removing error bars is to select and delete them via the right-click context menu.
While error bars can be useful to explain data, they aren’t used as often with PowerPoint charts. This is because many people might be unable to understand or interpret error bars. This raises the question of whether to use error bars when considering how to make a presentation with charts. Therefore, when considering how to make a presentation graph, you need to gauge the utility of error bars for your audience.