Support Team PowerPoint Dashboard
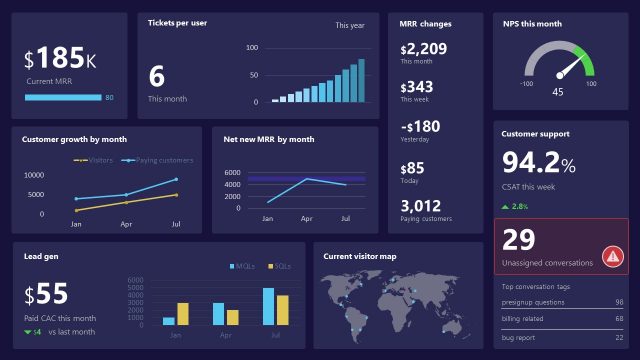
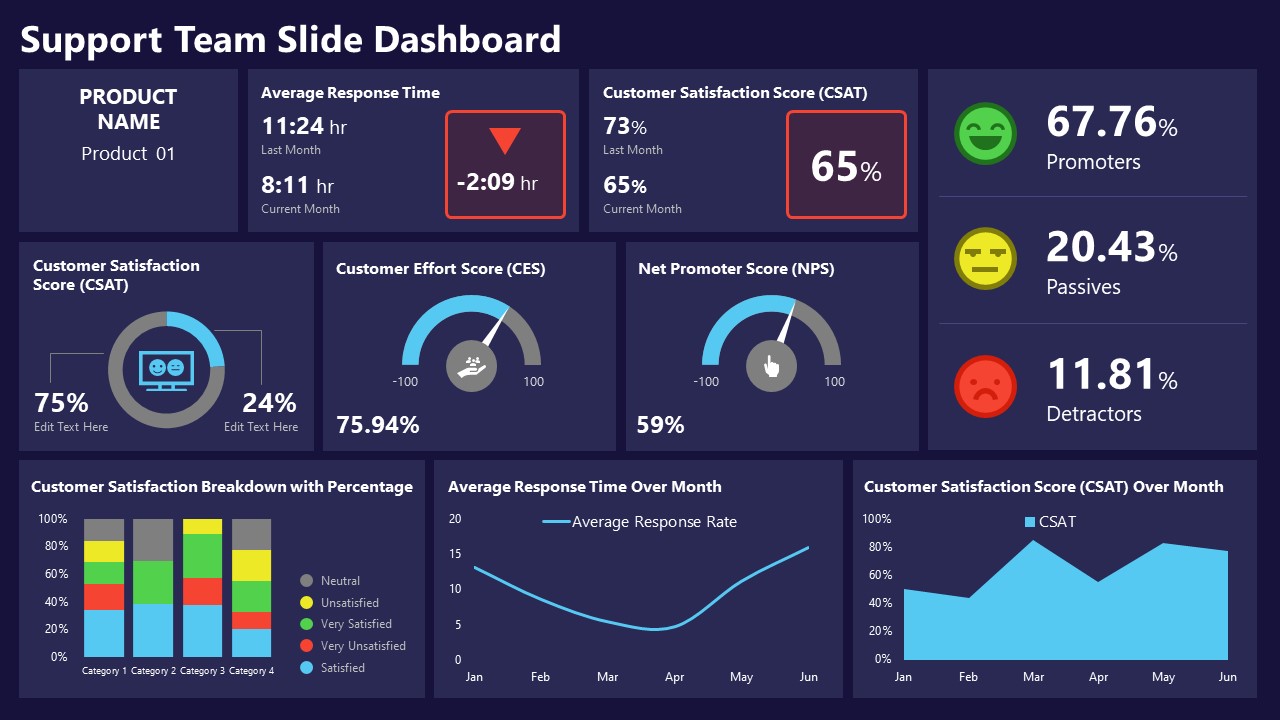
The Support Team PowerPoint Dashboard is a one-pager template to display customer KPIs data that can assist the support team in management functions. The main goal of customer support is user satisfaction which is measured through various metrics. This PowerPoint dashboard displays the values for such customer metrics, i.e., NPS and CSAT, in the form of charts and tables. Hence, this visualization tool can assist support agents, team leads, and other members in improving the support services. Also, by taking account of these variables with time, analysts can track the service quality of support agents and provide appropriate recommendations to enhance their performance.
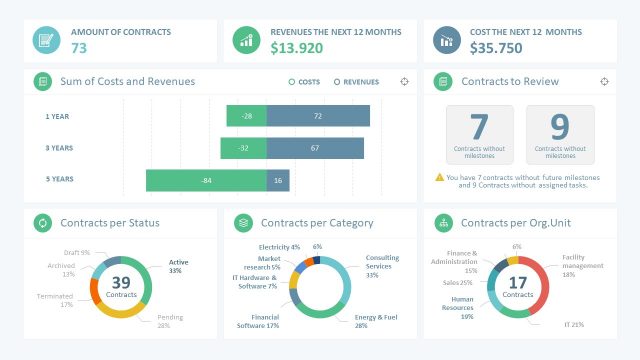
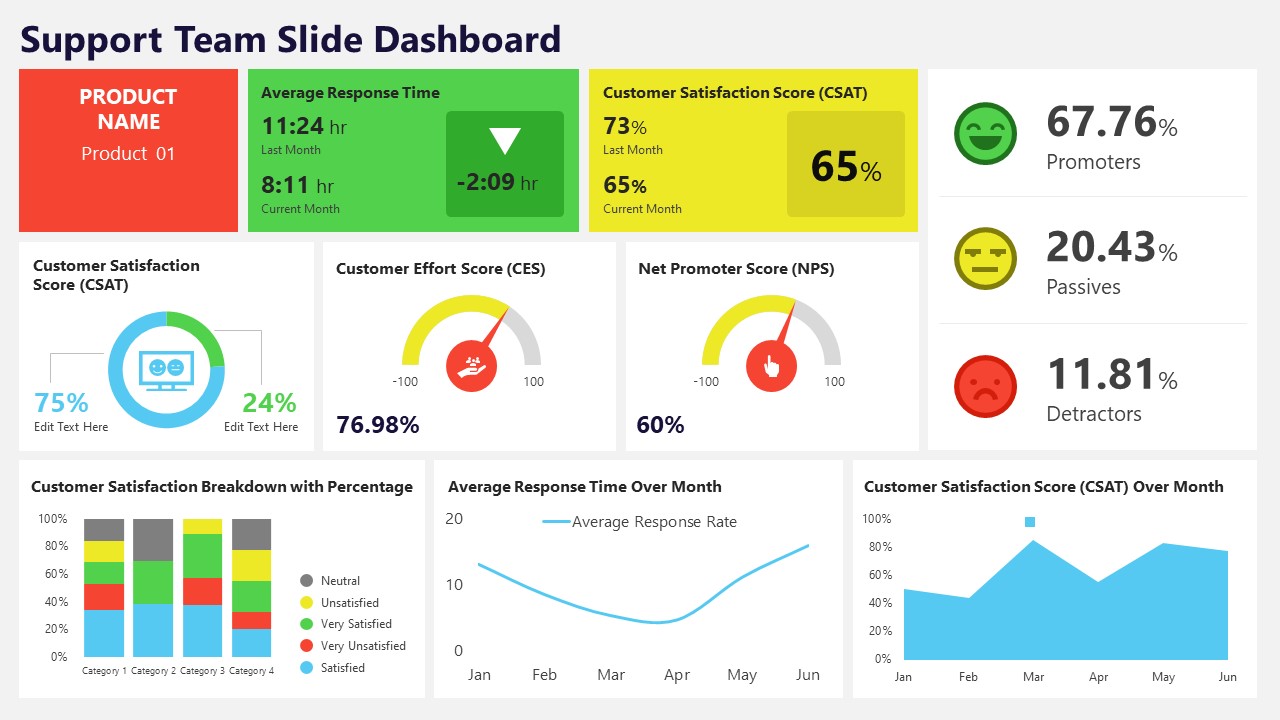
This customer support dashboard template is a one-pager slide comprising ten rectangular sections of varying dimensions. These segments have editable data charts, chart-like shapes, and space for adding numerical values prominently. Nine of the ten sections are arranged in three rows which represent the following details of customer support service:
- Product Name
- Average Response Time: numerical data in hours showing the average time taken by service desk agents to respond to the query
- Customer Satisfaction Score: percentage values for the metric representing how customers rated your support service
- CSAT by Incident and Forum: editable donut chart to show the distribution
- Customer Effort Score: a semi-circle meter gauge shape to show an average effort score calculated based on customers’ struggle for issue resolution
- Net Promoter Score: a chart shape to display the total NPS that represents the loyalty of your satisfied customers
- CSAT Percentage Breakdown: bar graph to show levels distribution of customers
- Average Response Time over a month: editable line graph to track the variations of response time within the month
- CSAT over a month: area chart to present the CSAT for a month
So, by adding custom values to the sections of this Support Team PowerPoint Dashboard, users can prepare a comprehensive report that can be presented before executives. Further, to make visual communication of ideas easier, three emojis are used on the right corner of the slide. The three faces, happy, neutral, and angry, are represented through green, yellow and red colors, respectively. Professionals can showcase the percentage value of NPS with these icons. This way, the audience can grab the summary of the report and know about the percentage of promoter, passive, and detractor customers.
All the components of our customer support dashboard template are 100% editable. Users can download and make necessary changes to make their professional presentation in a few simple steps. This slide is editable with PowerPoint, Google Slides and Keynote. Alternatively, presenters can download other dashboard template designs to create data presentations or download a Net Promoter Score PowerPoint template.

You must be logged in to download this file.
DOWNLOAD- Category
- Data & Charts
- Rating


 Loading...
- Size
- 16x9
- Item ID
- 21508-01
- Colors
Subscribe today and get immediate
access to download our PowerPoint templates.