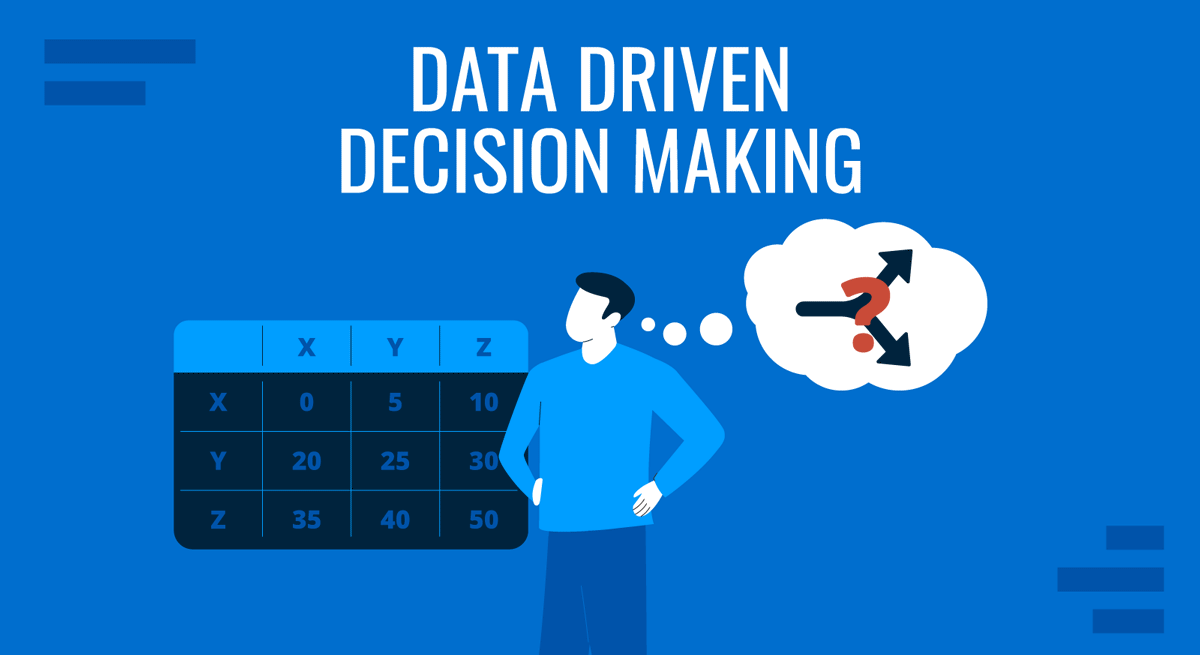
Data is what makes informed decisions in today’s corporate environment. From opting on which areas to invest, where to cut, which personnel requires extra training, and so on, data-driven decisions shape the outcome of multiple business transactions and stakeholder meetings. But how do we actually represent such data in a format that’s both compelling and not tedious for a stakeholder not directly involved in the data-gathering process?
In this article, we’ll discuss data-driven decision-making in presentations. It explores how to analyze data to make better-informed decisions and how to represent that data in presentations across various settings, including research and corporate environments.
Table of Contents
- What is Data-Driven Decision Making?
- How to Analyze Data to Make Better-Informed Decisions
- Differences Between Data-Driven and Data-Informed Decisions
- Decision-Making Frameworks and Models
- FAQs
- Recommended Templates for Data-Driven Decision Making Presentations
- Conclusion
What is Data-Driven Decision Making?
Data-driven decision making (DDDM) is the process of making choices based on empirical evidence and analytical reasoning derived from data. In contrast to decisions made solely on intuition or experience, DDDM leverages quantitative and qualitative data to inform and guide strategic actions.
How to Analyze Data to Make Better Informed Decisions
The first step in analyzing data to make better-informed decisions is to clearly define the problem or question at hand. Data analysis can become unfocused and yield irrelevant results without a well-articulated objective. Defining the scope of the study ensures that the data collected is pertinent and that the insights generated are actionable.
Once the objective is established, the next step is data collection. This involves identifying reliable data sources, including internal databases, surveys, market research, or publicly available datasets. Analysts must ensure the quality of the data; this data should be accurate, complete, and timely. Data cleaning is often necessary to address missing values, duplicates, and outliers, which can skew analysis and lead to erroneous conclusions.
Next, we must select the appropriate analytical methods. Statistical techniques such as regression analysis, hypothesis testing, and time-series analysis can uncover relationships and trends within the data. Advanced analytics may involve machine learning algorithms for predictive modeling and clustering. The choice of method depends on the nature of the data and the specific questions being addressed.
When interpreting the results, analysts must consider the context in which the data exists, potential biases, and the methodologies’ limitations. It’s important to distinguish between correlation and causation; just because two variables are related does not mean one causes the other. Sensitivity analysis can assess how results change with different assumptions or parameters.
Communicating findings effectively is the final step in the analysis process and what brings us here as presenters. This involves summarizing key insights in a manner understandable to stakeholders who may not have technical expertise. Visual aids such as data charts, graphs, and dashboard templates can enhance comprehension. Recommendations should be clearly linked to the data analysis, providing a rationale for proposed actions.
Implementing data-driven decisions also requires monitoring and evaluation. Organizations can assess their strategies’ effectiveness by tracking decision outcomes and making necessary adjustments. This creates a feedback loop that enhances learning and continuous improvement.
Differences Between Data-Driven and Data-Informed Decisions
While both approaches value data, they differ in how data is used in decision-making.
Data-Driven Decisions are those where data is the primary basis for making choices. This approach relies heavily on quantitative analysis and often utilizes statistical models, algorithms, and predictive analytics. The assumption is that data provides an objective foundation that minimizes bias and errors in judgment. Data-driven decisions are common in fields like finance, supply chain management, and digital marketing, where metrics are readily available and can be precisely measured.
The advantages of data-driven decisions include increased efficiency, consistency, and the ability to scale decision-making processes. However, this approach may overlook qualitative factors such as customer sentiment, employee morale, or cultural nuances. It can also lead to overreliance on historical data, which may not account for unprecedented events or shifts in the external environment.
Data-Informed Decisions, on the other hand, involve using data as one of several inputs in the decision-making process. While data provides valuable insights, it is considered alongside other factors such as experience, intuition, stakeholder values, and contextual knowledge. This approach recognizes that data may not capture every aspect of a situation and that human judgment plays a critical role.
Data-informed decisions are particularly useful in complex or ambiguous situations where data may be incomplete or open to interpretation. They allow for flexibility and adaptability, incorporating insights that may not be quantifiable. However, this approach carries the risk of cognitive biases influencing decisions and may lead to inconsistency if not properly managed.
Choosing between data-driven and data-informed approaches depends on the context. A data-driven approach may be appropriate in environments where data is reliable, comprehensive, and relevant. On the other hand, a data-informed strategy may be more effective in situations requiring nuanced understanding or where data is scarce or uncertain. In practice, a hybrid model that integrates both postures is often applied alongside clear guidelines on when to lean into each model.
Decision-Making Frameworks and Models
This section will mention some of the most valuable tools to represent DDDM in presentations. We highly recommend you check our article on data presentations for how to accurately extract the most out of your data for engaging and understandable slides.
The Recognition-Primed Decision (RPD) Process
The Recognition-Primed Decision (RPD) process is a model that describes how experienced individuals make rapid and effective decisions without comparing multiple options. Formulated by cognitive psychologist Gary Klein, the RPD process is derived from an observation of the work agenda of firefighters and military commanders, who operate under time pressure and uncertainty. The model combines intuition and analysis, suggesting that decision-makers rely on pattern recognition based on their experiences to quickly identify viable courses of action.
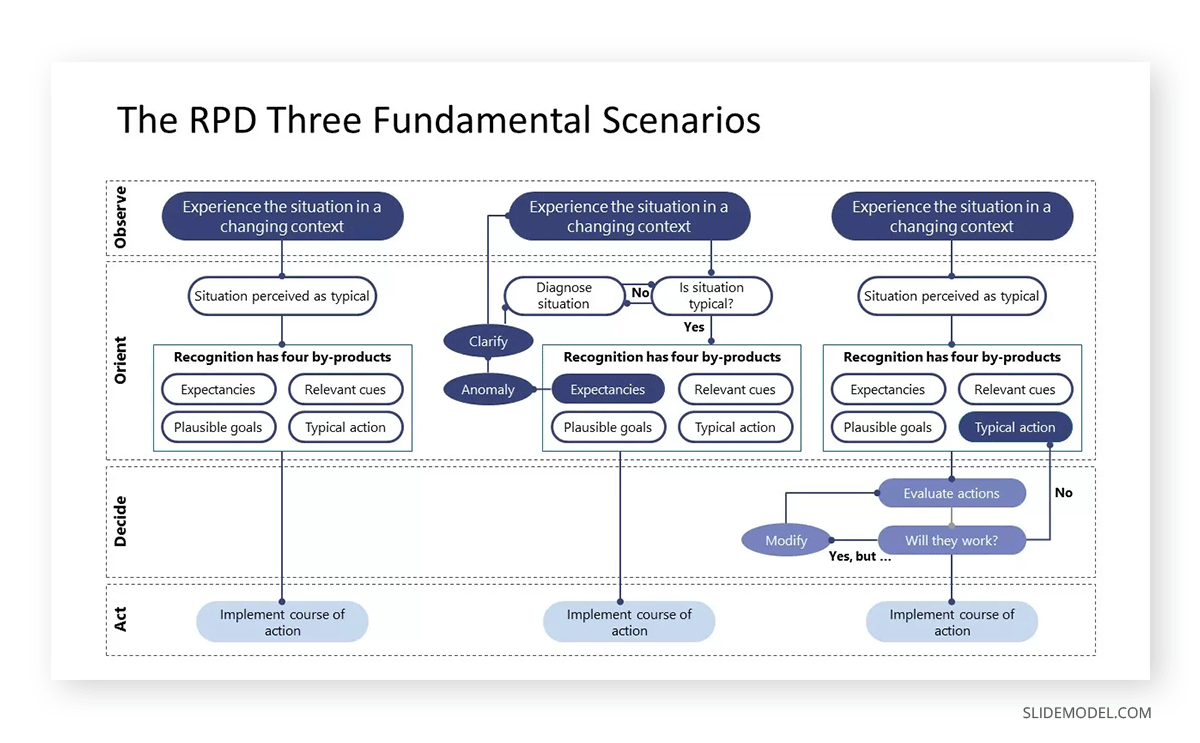
In the RPD process, decision-makers first recognize a situation as familiar, enabling them to retrieve a suitable response from memory. Stakeholders then mentally simulate the action to foresee potential outcomes and assess its feasibility. If the initial option appears workable, they proceed without considering alternatives. This pragmatic approach prioritizes speed and effectiveness over exhaustive analysis.
Leveraging data analytics to augment experience can undoubtedly enhance the RPD process in data-driven decision-making. Real-time data feeds and predictive models can provide the cues for pattern recognition, especially for less experienced decision-makers. For instance, in financial trading, algorithms analyze market data to identify patterns that signal buying or selling opportunities.
However, the RPD process has limitations, including the risk of cognitive biases and reliance on experience, which may not apply to novel situations. Integrating data analytics can mitigate risks by providing objective insights that complement intuition.
The Kepner-Tregoe Matrix
The Kepner-Tregoe Matrix is a systematic methodology for problem-solving and decision-making developed by Charles Kepner and Benjamin Tregoe. It provides a structured approach to analyzing situations, identifying root causes, evaluating alternatives, and anticipating potential problems. The process involves four key components: Situation Analysis, Problem Analysis, Decision Analysis, and Potential Problem Analysis.
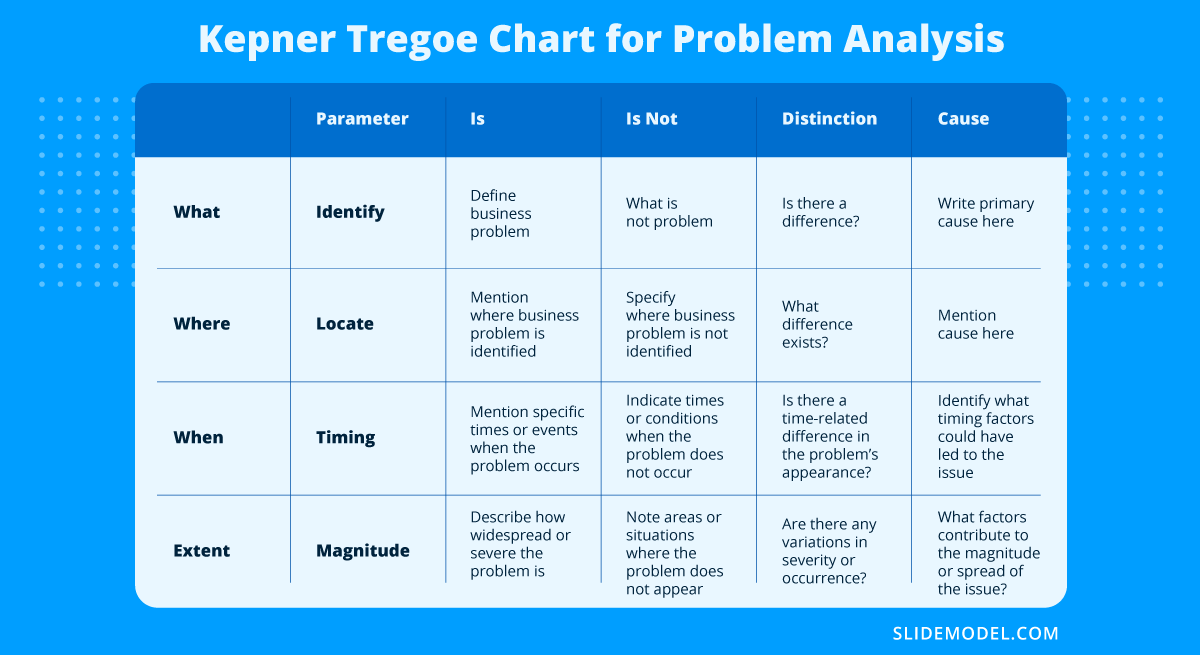
In Situation Analysis, issues are identified and prioritized based on urgency and impact. Problem Analysis delves into understanding the root causes of a problem through data collection and analysis. Decision Analysis involves establishing objectives, identifying alternatives, and evaluating them against criteria weighted by importance. Potential Problem Analysis anticipates future issues arising from the chosen solution and develops preventive measures.
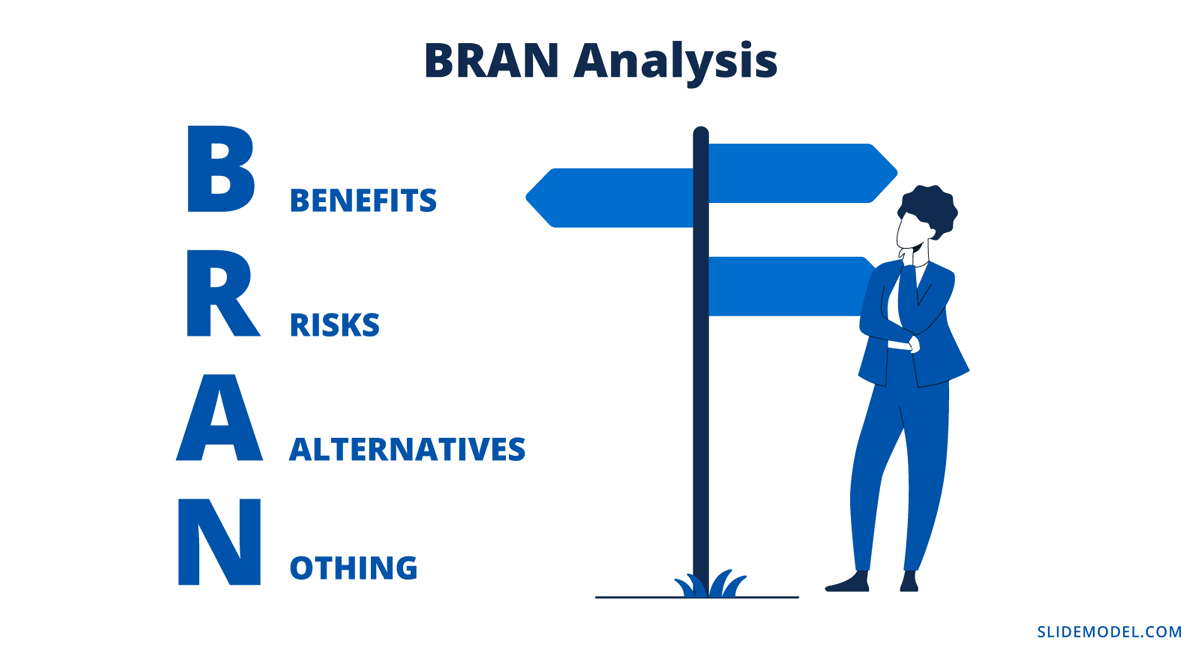
BRAIN, BRAN, and BRAID Decision Models
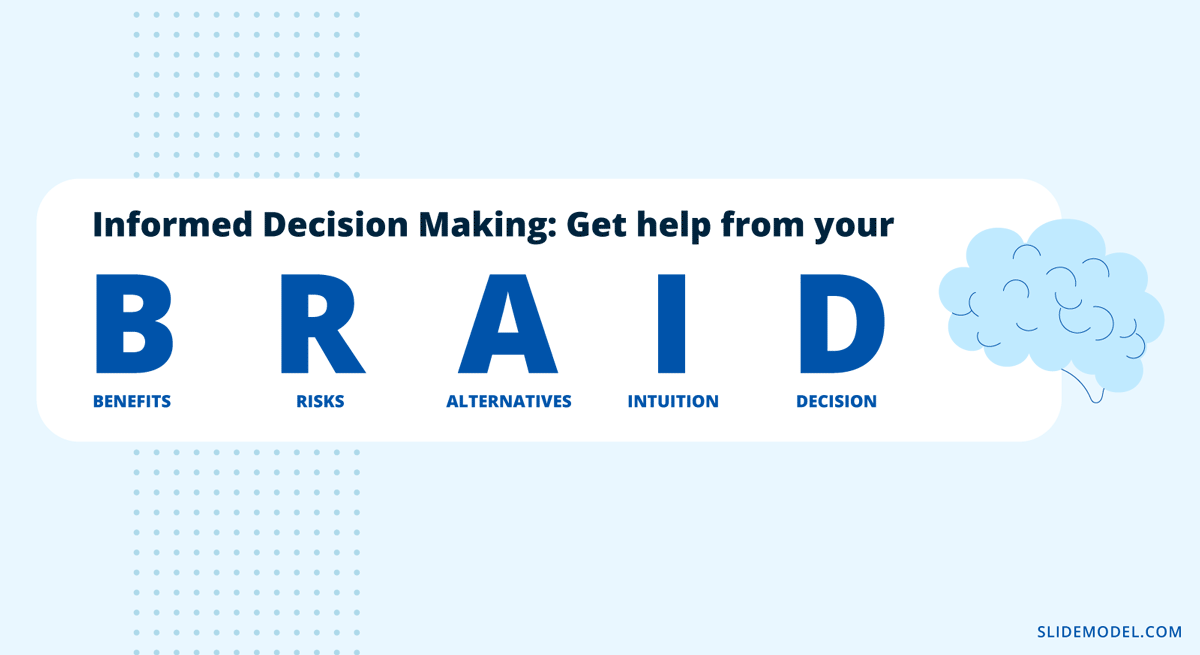
The BRAIN, BRAN, and BRAID models are mnemonic-based frameworks designed to facilitate quick yet comprehensive decision-making. They prompt individuals to consider Benefits, Risks, Alternatives, Intuition (included in BRAIN and BRAID), and Decision (emphasized in BRAID). The BRAN model omits Intuition, focusing solely on Benefits, Risks, Alternatives, and doing Nothing.
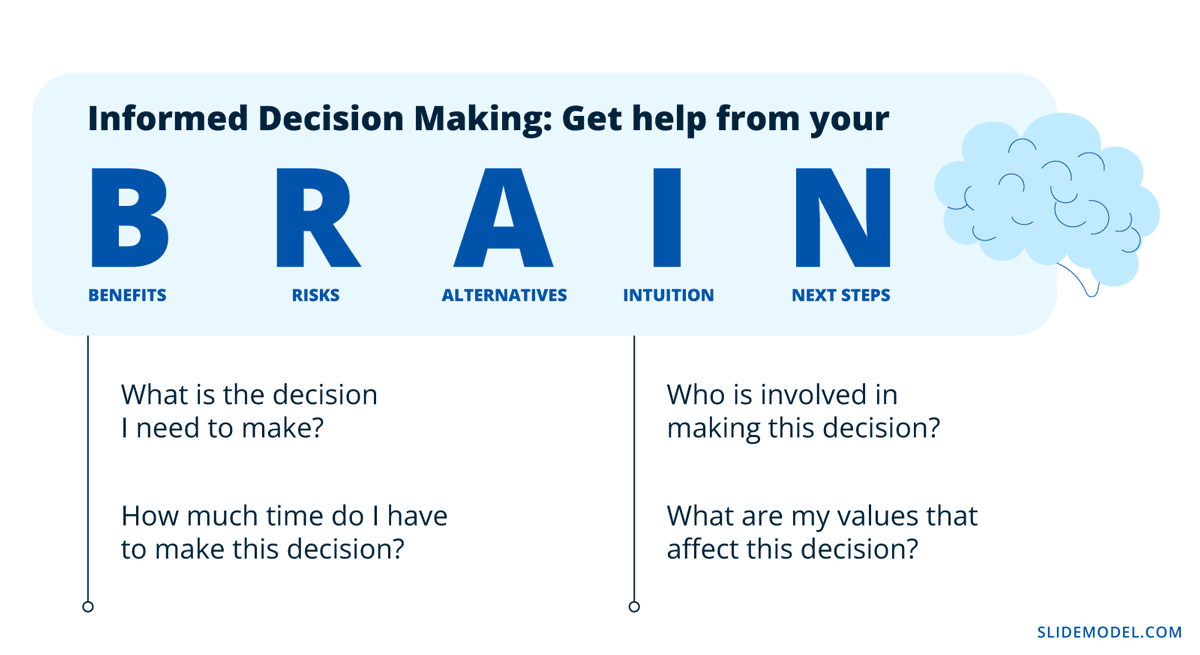
These models are particularly useful in high-pressure situations where time is limited. By systematically evaluating the pros and cons, exploring alternative options, and reflecting on intuition, decision-makers can swiftly make balanced choices.
The addition of Decision in the BRAID model underscores the importance of committing to a choice after careful consideration. Integrating data into each component enhances decision quality, providing empirical support for benefits, risks, and alternatives. This combination of structured analysis and intuitive judgment helps ensure that even rapid decisions are well-informed and aligned with organizational goals.
The Vroom-Yetton Decision Model
The Vroom-Yetton Decision Model guides leaders in selecting the most appropriate decision-making style based on situational factors. It outlines five leadership styles, from autocratic to collaborative, and uses a decision tree to determine the optimal approach. Key factors include the importance of decision quality, the need for subordinate commitment, problem structure, and expertise levels.
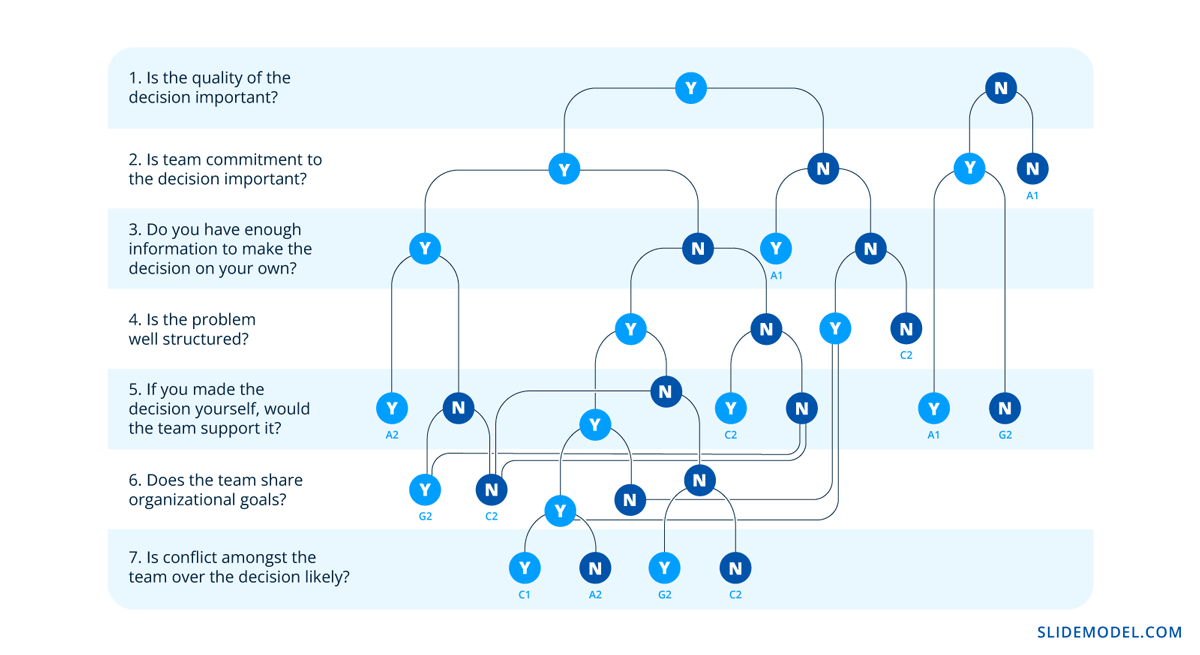
This model helps align leadership style with data insights in data-driven decision-making. For example, an autocratic approach may be appropriate when the leader has sufficient expertise and when the quality of decisions is critical. Conversely, a collaborative style is preferable if subordinate commitment is essential and the team has relevant expertise.
Check our Vroom-Yetton Decision Model PowerPoint Template.
TDODAR Decision Model
The TDODAR model is a structured approach used primarily in aviation for decision-making under pressure. It stands for Time, Diagnosis, Options, Decide, Act/Assign, and Review. This step-by-step process ensures that critical factors are considered swiftly and systematically.
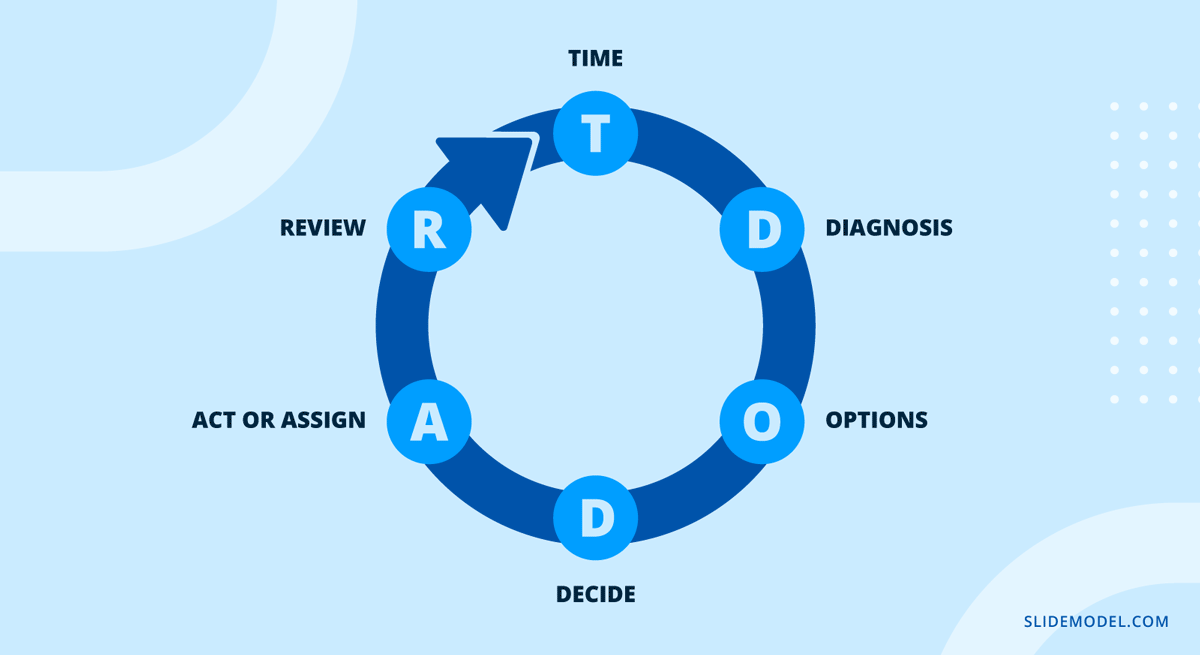
In data-driven contexts, TDODAR emphasizes using data for accurate diagnosis, evaluating options based on empirical evidence, and continuous monitoring through review. It’s particularly valuable in time-critical situations where decisions must be made quickly but thoughtfully.
The model offers clarity and efficiency but depends on the availability of accurate data. Training is required to implement effectively under stress.
Check our TDODAR PowerPoint Template.
OODA Loops
The OODA Loop, developed by Colonel John Boyd, describes a continuous cycle of Observe, Orient, Decide, and Act. It’s designed for dynamic and adversarial environments where rapid adaptation is essential. Individuals and organizations can respond effectively to changing conditions by continuously cycling through these stages.
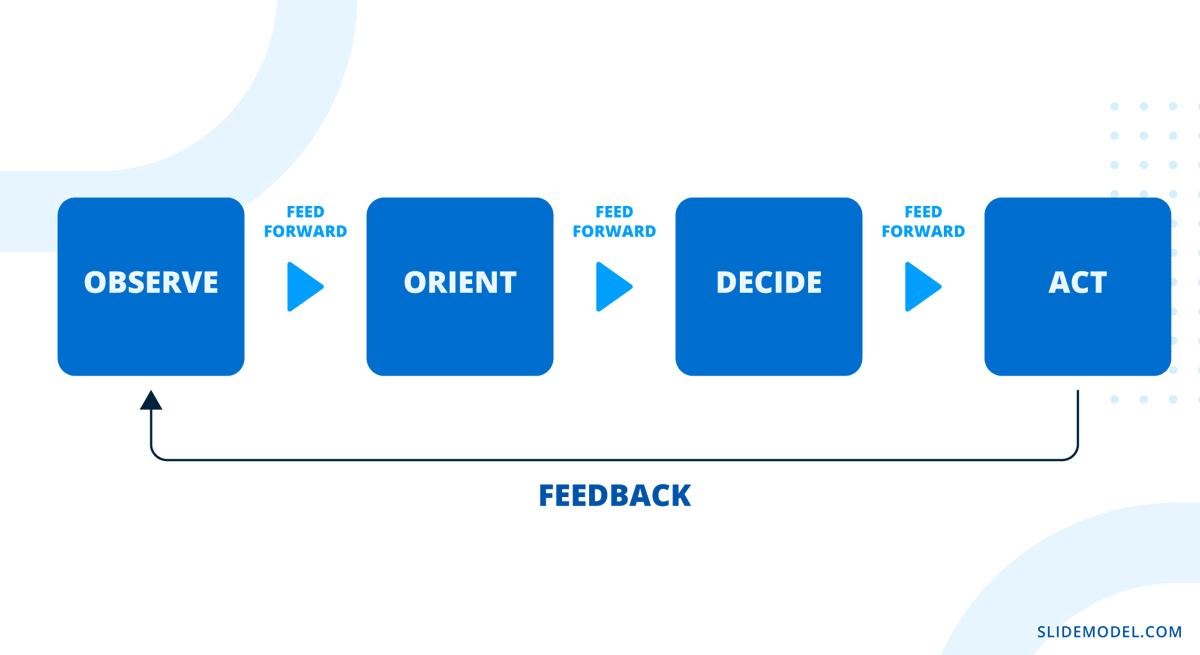
In DDDM environments, the OODA Loop integrates real-time data analysis at each stage. Observing involves collecting data; Orienting requires interpreting data to update mental models; Deciding uses data-driven strategies; Acting implements decisions while monitoring outcomes.
As a downside, we can say that the OODA Loop promotes agility and continuous improvement but can be complex, requiring sophisticated data systems. It also demands effective filtering to prevent information overload.
Check our OODA Loop PowerPoint template.
ORAPAPA Model
The ORAPAPA framework is a strategic decision-making model designed to guide individuals and organizations through a comprehensive evaluation process when faced with complex decisions. The acronym ORAPAPA stands for Outcomes, Risks, Alternatives, Past experience, Analysis, People, and Alignment. Each component represents a critical aspect of the decision-making process, ensuring that all relevant factors are considered.
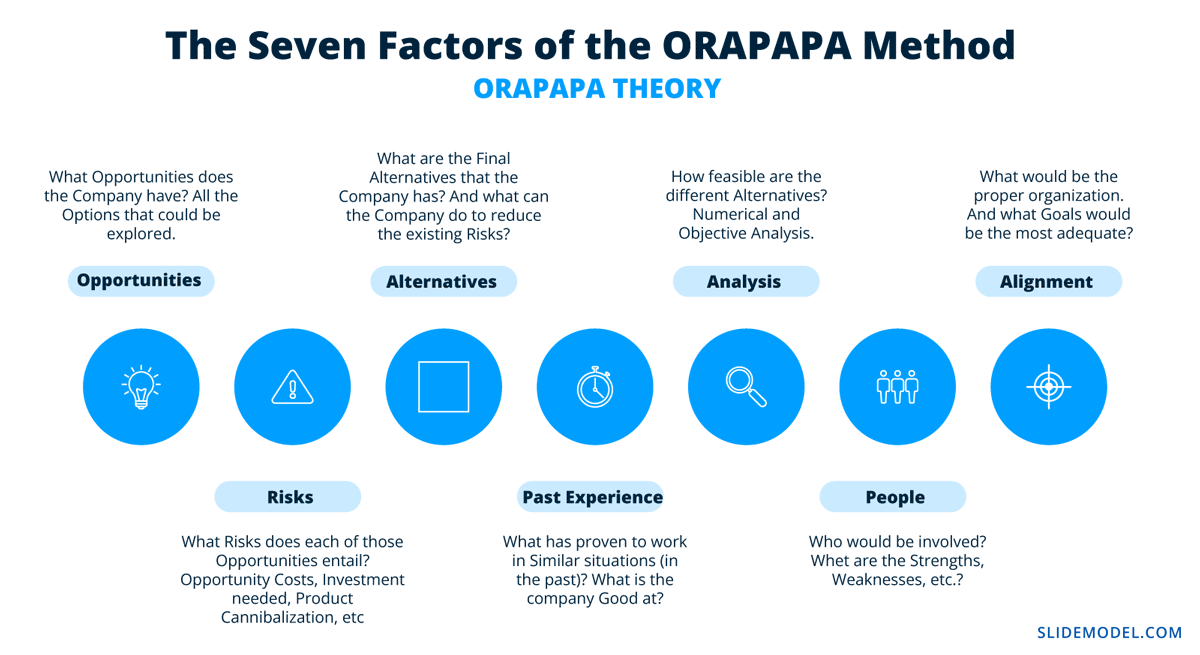
When integrated with data-driven methodologies, the ORAPAPA framework enhances the quality and effectiveness of decisions by grounding them in empirical evidence.
Alternatively, check our article about decision making for business leaders and our complete collection of decision making PowerPoint templates.
FAQs
What is the role of data visualization in data-driven decision making?
Data visualization transforms complex data sets into graphical representations like charts, graphs, and dashboards. This makes identifying patterns, trends, and outliers easier, facilitating a quicker and more adequate understanding of the data. Visualization aids in communicating insights to stakeholders who may not have technical expertise, making it an essential tool for presenting findings and supporting data-driven decisions.
How do I choose the right data visualization for my presentation?
Choose the visualization that best matches the type of data and the message you want to convey. For comparisons, use bar charts; for trends over time, line graphs are effective; for parts of a whole, pie charts can be helpful; and for relationships between variables, scatter plots are appropriate. The key is selecting a format that clearly presents the data and enhances the audience’s understanding.
What are common pitfalls to avoid in data-driven presentations?
Avoid overloading slides with excessive information, which can overwhelm the audience. Choose appropriate scales and formats for visualizations to ensure that they are not misleading. Tailor the presentation to the audience’s level of expertise, avoiding jargon if necessary.
How can I balance data analysis with human intuition in decision making?
Balance is achieved by using data to inform and support decisions while also considering qualitative factors like experience, intuition, and contextual nuances. Recognize that data may not capture all aspects of a situation. Involve experts who can provide insights beyond the data.
How can I develop data literacy skills?
Develop data literacy by engaging in continuous learning through online courses, workshops, and certifications focusing on data analysis and interpretation. Practice with real datasets using tools like Excel, Tableau, or Python. Read books and articles on data topics, and participate in discussions or forums. Organizations can support this by providing training programs and encouraging a culture of data exploration.
How can I ensure my data-driven decisions are aligned with business objectives?
Ensure alignment by clearly understanding and articulating the organization’s goals. Use key performance indicators (KPIs) to measure how decisions contribute to these goals. Involve stakeholders in the decision-making process to gain diverse perspectives. Regularly review and adjust strategies based on data insights to stay on course with the organization’s mission and objectives.
Recommended Templates for Data-Driven Decision Making Presentations
If you’re looking to create your very own DDDM slides, go no further. Check this selection of tailored PowerPoint and Google Slides templates for data-driven decision making scenarios.
1. Recognition-primed Decision (RPD) Process Data-Driven Template for PowerPoint
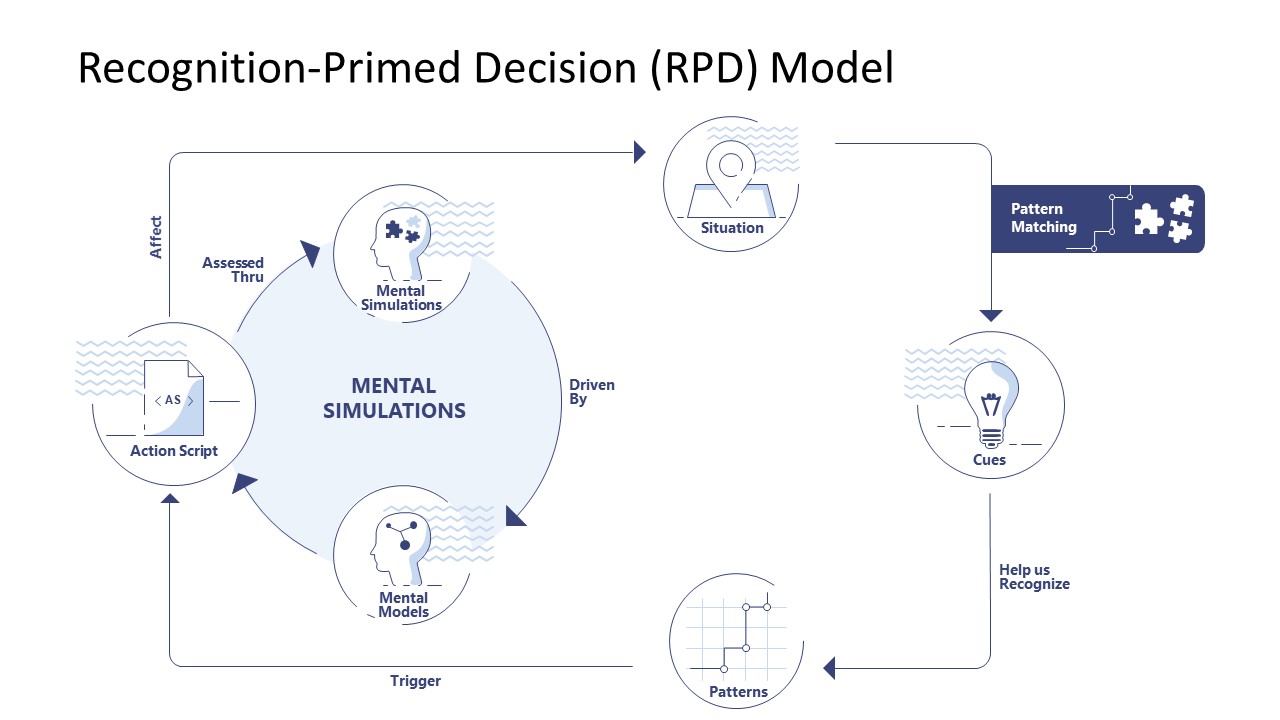
The Recognition-primed Decision (RPD) Process Template for PowerPoint is designed to visually explain the RPD decision-making model, which aids in decision-making under time pressure and incomplete information. It includes flowcharts and diagrams to illustrate three levels of decision-making, from typical situations to complex scenarios requiring mental simulations.
2. Kepner Tregoe DDDM PowerPoint Template
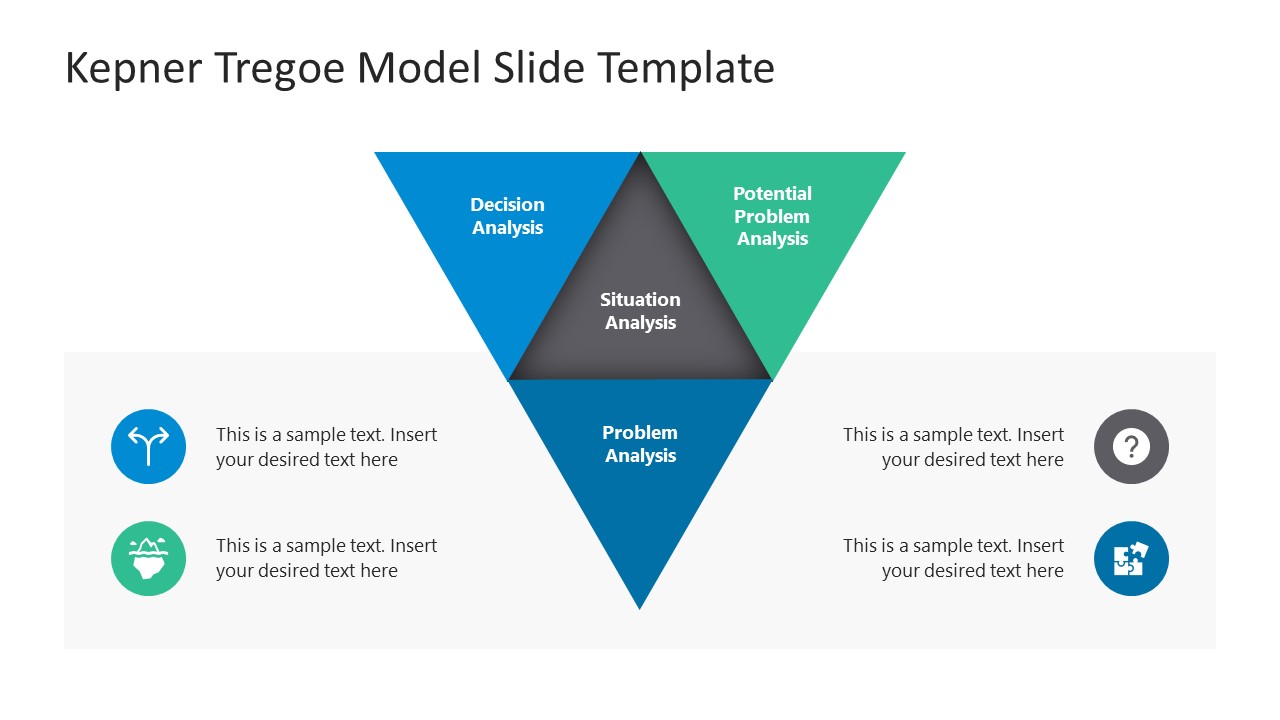
Our Kepner-Tregoe PowerPoint Template is designed to facilitate the structured Kepner-Tregoe problem-solving methodology. It presents the process through visually engaging diagrams like inverted pyramids, hexagons, and flowcharts to help users define situations, analyze problems, make decisions, and assess potential risks. This template is ideal for teams and professionals who need to discuss strategies and prioritize actions.
3. Vroom-Yetton Decision Model DDDM PowerPoint Template
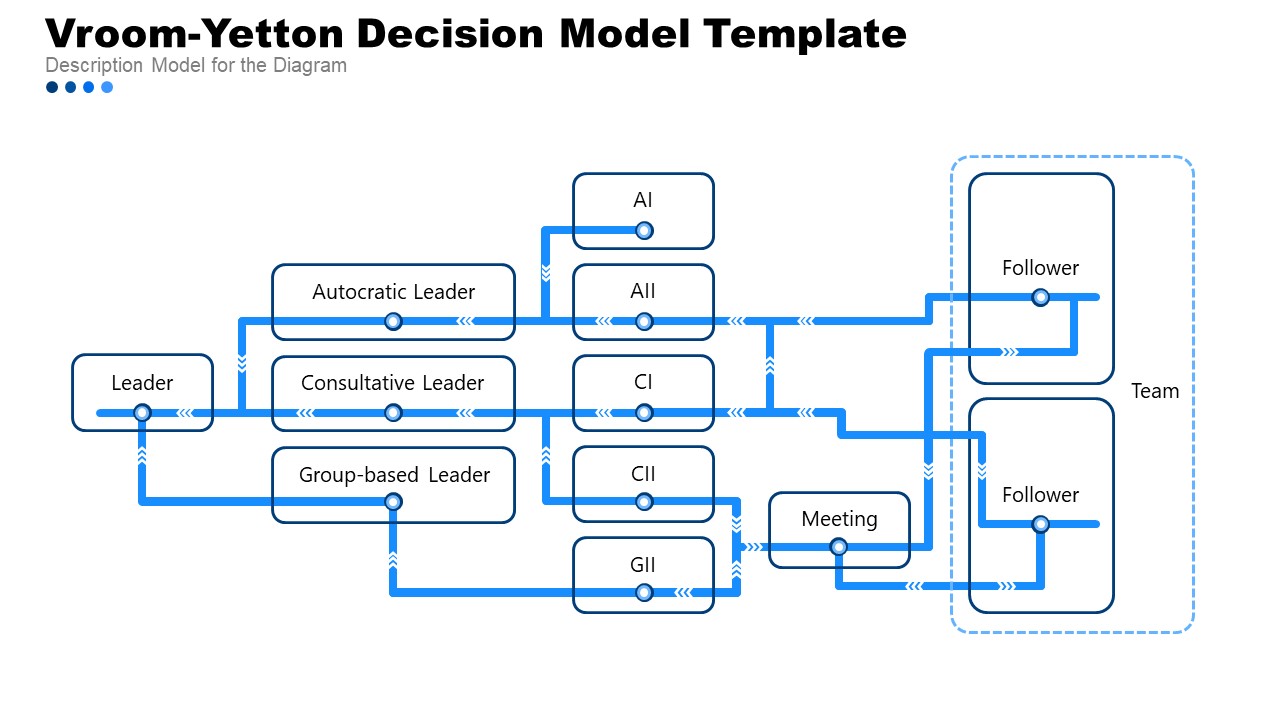
The Vroom-Yetton Decision Model PowerPoint Template is a dynamic tool designed for leaders who want to improve their decision-making processes. It provides clear, structured visuals such as decision trees and flowcharts to map out different leadership styles and decision-making approaches. This model emphasizes choosing the right leadership style depending on specific circumstances, whether it’s involving the team or making decisions independently.
4. TDODAR Data-Driven PowerPoint Template
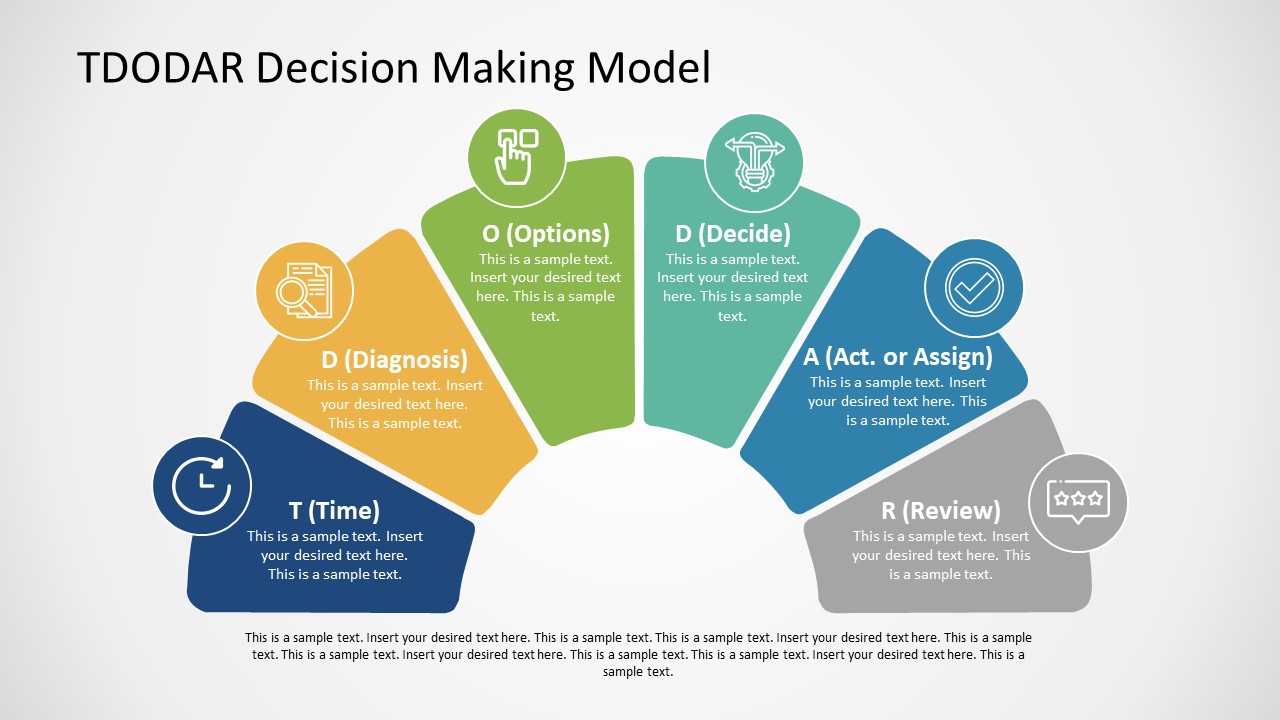
Designed to break down decision-making in high-pressure environments, this DDDM template focuses on the six steps of the TDODAR model: Time, Diagnose, Options, Decide, Act, and Review. It’s particularly useful for industries like aviation and emergency services, where quick, structured decision-making is essential.
5. OODA Loop PowerPoint Template for Data-Driven Presentations
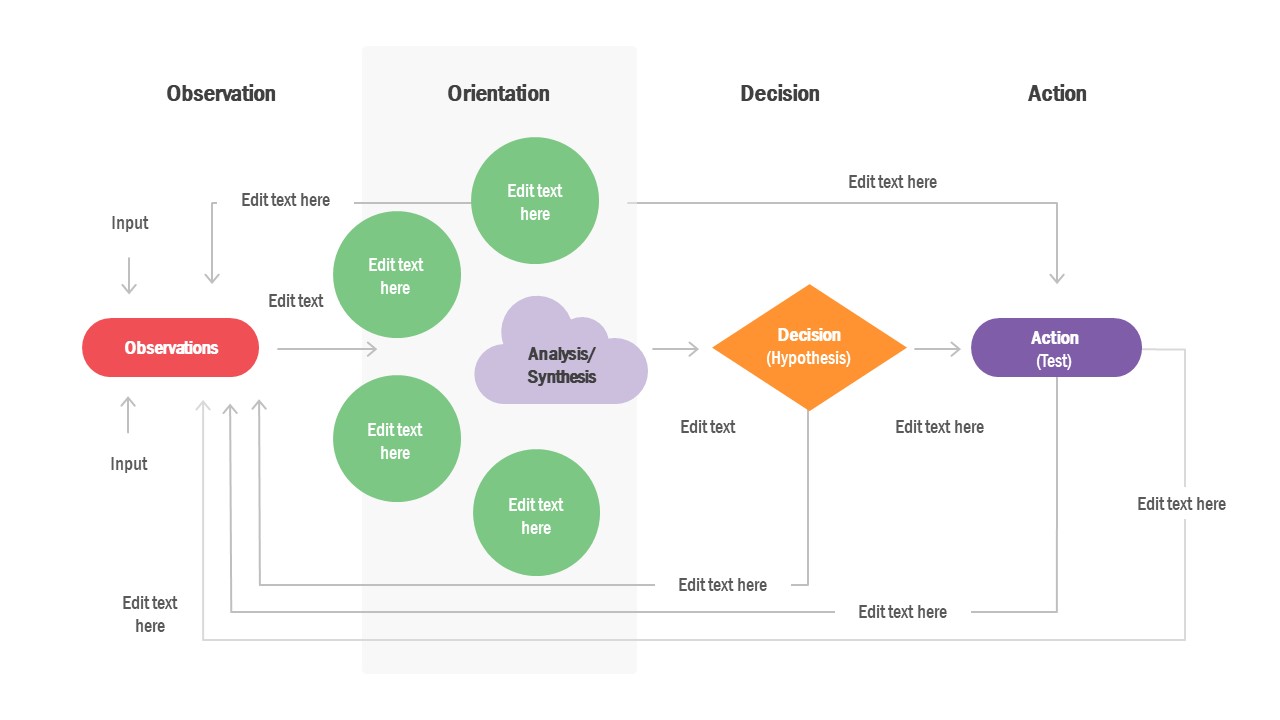
Focused on strategic decision-making, this data-driven decision making template presents the OODA Loop framework—Observe, Orient, Decide, and Act. Originally used in military strategy, it’s a highly adaptable model for business and competitive environments. The slides break down each step with visuals that guide users through the iterative process, emphasizing agility and quick response to changing situations. Perfect for teams that need to refine decision-making in dynamic environments.
Conclusion
As technology continues to evolve, embracing data-driven approaches is advantageous and necessary for future success. Organizations and individuals that invest in developing these skills are better positioned to adapt to changes, seize opportunities, and drive progress.
In presentation design, acknowledging how to represent data accurately for decision-making processes is critical. You can consider it a long-term investment that will pay off for the effort it took to master. Additionally, presenters should consider focusing on data storytelling to make their slide decks far richer regarding retention rate. Build a narrative around the preferred models used to depict information in DDDM, and allow the audience to connect with the importance of that information in a more digestible format than raw numbers.