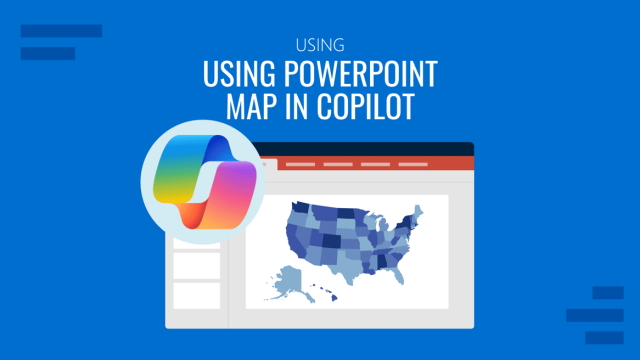
How to Populate a PowerPoint Map Using Copilot
See the exact Copilot prompt that reads an Excel address list and drops pins, city labels and a filled table onto a map slide.
How to Add Video to Canva
Still treating Canva as a static design tool? It handles video too. Here’s a practical walkthrough to get clips into your projects without the guesswork.

EBITDA Slide in Presentations
A practical guide to designing EBITDA slides, from choosing chart types to structuring the bridge for board and investor decks.
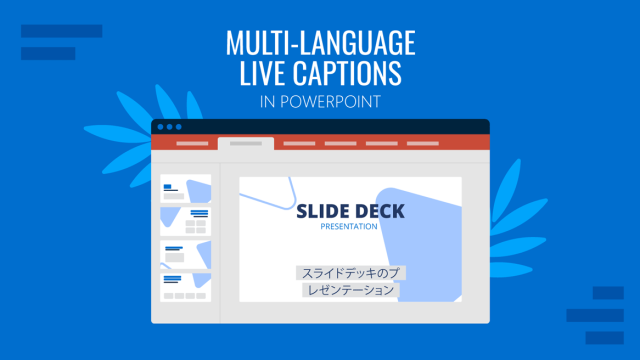
How to Translate Live Captions in PowerPoint for Multilingual Presentations
Discover how easy is to use multilingual live captions in PowerPoint and create content for multicultural audiences.
How to Add Audio to Canva
From presentations to social videos, the right audio makes a difference. Discover how to upload, sync, and manage sound directly inside Canva.

Churn and Retention Analysis Presentation
From defining your metrics to framing your findings, learn how to deliver a churn and retention analysis presentation that drives action and clarity.

How to Insert Emoji in PowerPoint
Emoji can make slides more relatable and visually engaging. Here’s how to insert them in PowerPoint and use them effectively without overdoing it.
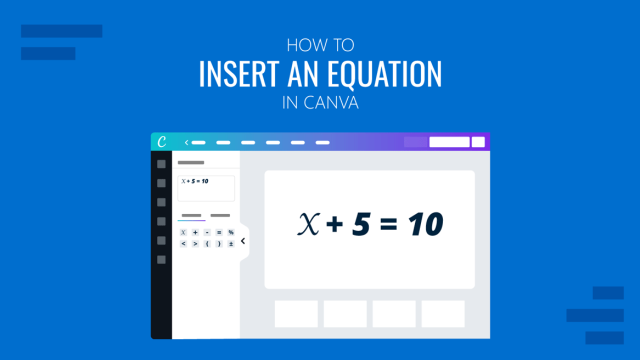
How to Insert an Equation in Canva
Learn how to insert an equation in Canva and present mathematical content clearly in any design.
ESG and Sustainability Report Presentation
Your audience already assumes the numbers are flattering. How to build an ESG deck that answers that assumption.