Maps are useful for showing locations, routes, or geographic data in presentations. However, a static map can sometimes feel flat. Learning how to animate a map in PowerPoint can help guide your audience regarding location-based information, highlight regions, and create a more engaging storytelling experience. In this guide, we will demonstrate how to create an animated PPT map using PowerPoint animations and transitions. We will also explain how to use professional templates, such as PowerPoint map templates, to simplify the process and improve visual quality.
Why Animate a Map in PowerPoint
Animating maps helps you present information progressively instead of overwhelming your audience all at once. Instead of showing all locations at once, you can reveal them gradually. Animated maps are useful not only for showing expansion across regions or highlighting travel routes, but also for explaining geographic data or presenting location-based timelines. Animated maps can show expansion across regions, highlight travel routes, explain geographic data, and present location-based timelines. They are especially effective in business presentations, logistics planning, regional analysis, and training materials.
Different Methods to Animate a Map in PowerPoint
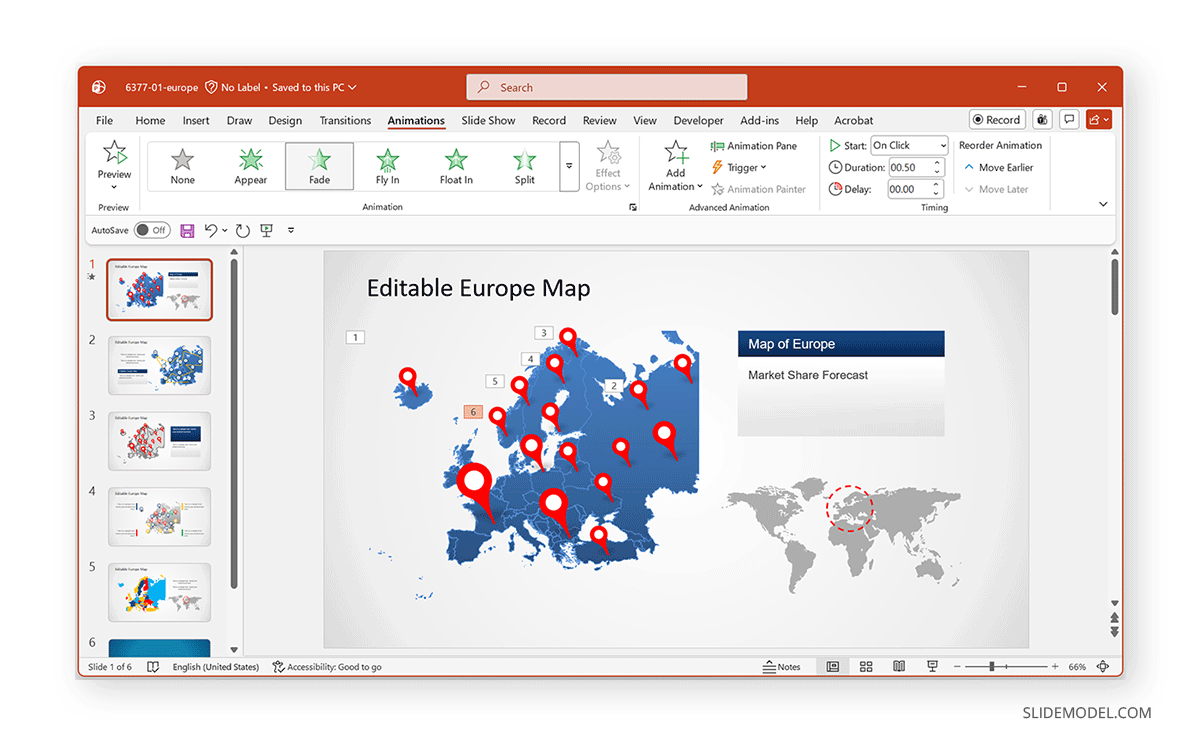
You can animate maps in PowerPoint using different methods, including ready-made map templates or static images with animations and transitions. To demonstrate the various methods, we will use the Europe Map Template for PowerPoint as an example.
Method 1: Animate a Map Using a PowerPoint Map Template
One of the easiest ways to create an animated map presentation is to start with a predesigned template. You can explore PowerPoint maps from SlideModel, which include editable map shapes for countries, regions, and continents. These templates are designed so that each area can be animated individually.
Step 1: Open your PowerPoint presentation, insert a map slide from a SlideModel template, and choose a map layout (e.g., world, country, or regional maps). Make sure map elements are separate shapes, not a single image.
Step 2: Select a region to animate by clicking on a specific country or region within the map. Each shape can be animated individually, allowing you to control how locations appear.
Step 3: Go to Animations -> Add Animation to apply an animation to a part of the map. Common entrance effects for maps include:
- Fade for a smooth appearance
- Appear for instant visibility
- Wipe for directional reveal (useful for routes)
- Zoom to emphasize importance
Note: To animate multiple locations, select each region and apply the same animation.
Step 4: Open the Animation Pane to arrange animations in order.
Set animations to: On Click (manual control) or After Previous (automatic sequence).
Step 5: Fine-tune animation timing and duration. For example, you can use a duration from the Animations tab (e.g., 1 second) for smooth flow and delay with small gaps between regions. This creates a clean storytelling effect.
Method 2: Animate a Route on a Map
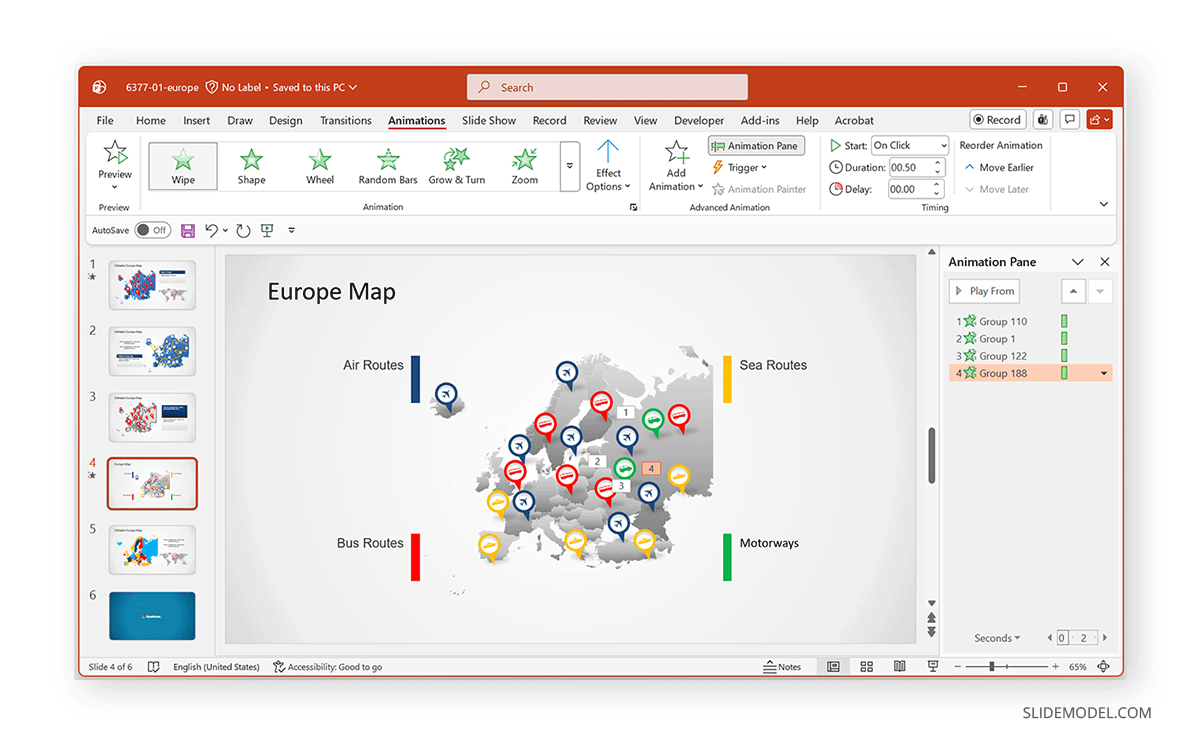
If you want to show routes (e.g., travel path), you can animate a route line using a static map image, your own drawn map, or an editable map template.
Step 1: Draw the Route by going to Insert -> Shapes -> Line or Curve and drawing a path between locations.
Step 2: Apply the Wipe animation by selecting the route line. The Wipe animation works best for routes and shows a direction that matches the travel path.
Step 3: Add markers or stops by inserting icons (pins and circles), and animate them with Fade and Zoom animations.
Step 4: Use the Animation Pane to animate the route first, then reveal the stops. This creates a guided journey effect.
Method 3: Use Morph Transition for Map Animation
The Morph transition is one of the most powerful tools for creating smooth map animations.
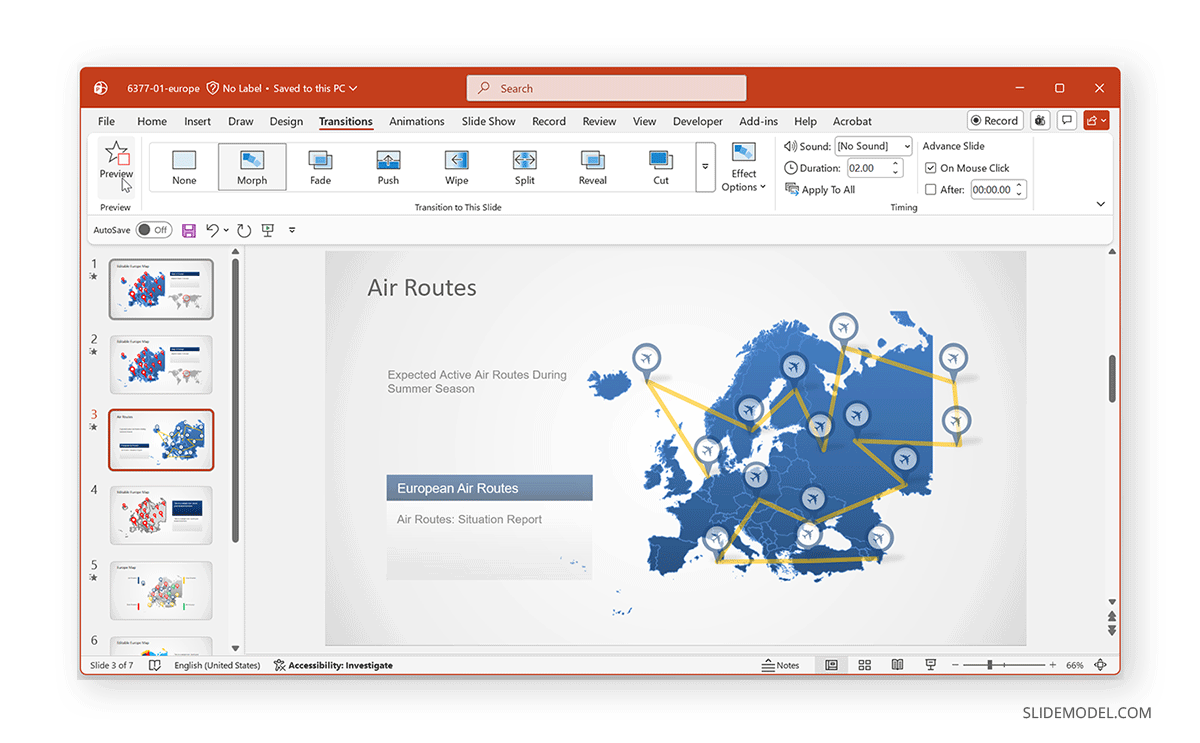
Step 1: Duplicate the Slide. You can do this via the right-click menu by selecting Duplicate Slide. Alternatively, you can morph two separate slides to show a transition in routes.
Step 2: Modify the Second Slide by changing the region colors, slightly repositioning elements, and adding new labels.
Step 3: Apply Morph Transition via Transitions -> Morph, then apply it to the second slide.
Step 4: PowerPoint will automatically animate movement, color changes, and shape transformations to create an animation between slides.
Method 4: Highlight Regions with Emphasis Animations
Instead of revealing regions, you can highlight them.
Step 1: Select a map region. You can insert a static image or use a ready-made template with an editable map.
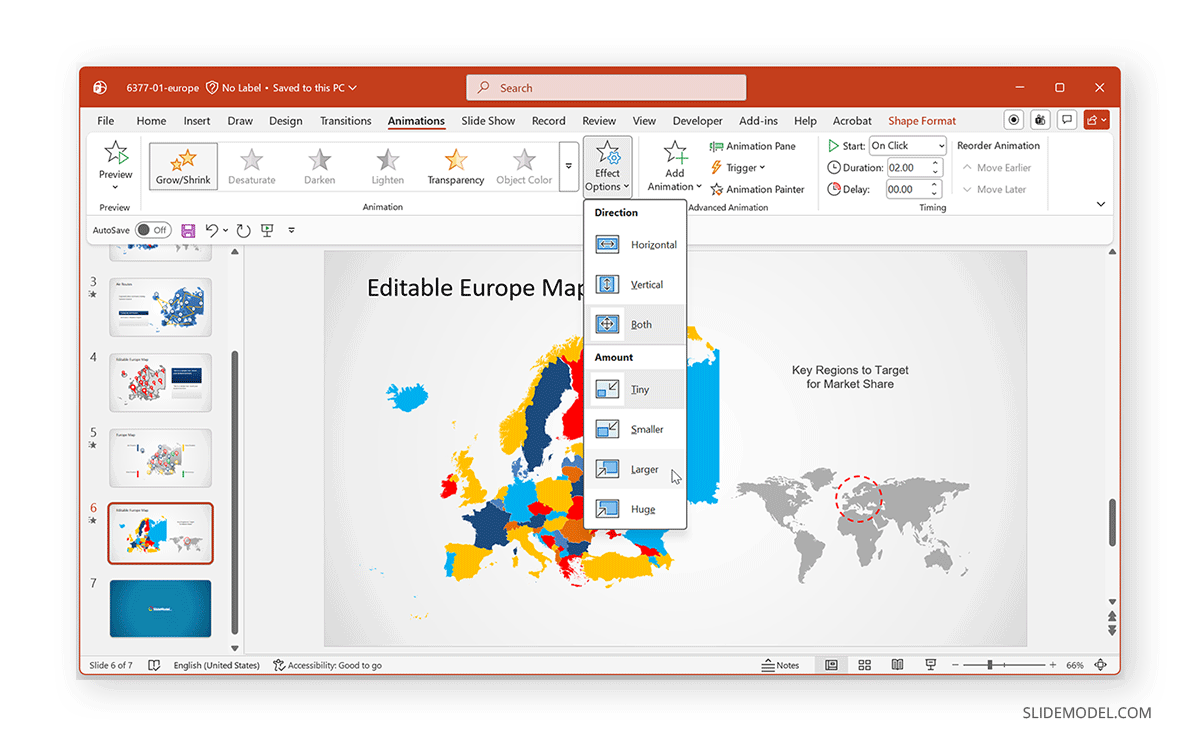
Step 2: Go to Animations -> Add Animation -> Emphasis. Popular effects that you can use include:
- Pulse to draw attention
- Grow/Shrink to emphasize importance
- Fill Color for changes to colors
Step 3 (Optional): Use Effect Options to select the size and direction of the animations.
Creating Effective Animated Map Presentations in PowerPoint
Animating a map in PowerPoint is most effective when you combine different animation techniques in a structured way. Instead of relying on a single effect, layering animations allows you to guide your audience through a narrative, revealing information step by step rather than all at once.
Build a Smooth Animated Sequence
A well-designed animated map typically follows a logical progression. You might begin by introducing the map with a subtle Fade effect to establish context. Next, use a Wipe animation to draw a route across locations, helping viewers follow movement or direction. Once the path is visible, add location markers with Fade or Zoom effects to highlight key stops. Then apply emphasis animations (such as Pulse or Color Fill) to draw attention to specific regions. Finally, use the Morph transition between slides to create seamless changes, such as shifting focus from one region to another. This layered approach creates a more engaging and intuitive viewing experience.
Keep Animations Simple and Purposeful
Using too many effects can distract your audience and reduce clarity. Stick to a few well-chosen animations that clearly communicate your intent. Make sure the animations you use support your message and don’t cause confusion.
Maintain Consistency Across Slides
Consistency helps your audience follow the story without confusion. Use similar animation styles, speeds, and transitions throughout your presentation to create a cohesive experience. You can adjust animation durations and types so each slide uses the same sequence style.
Use Timing to Guide Attention
Good timing is essential, so allow enough delay between animations for viewers to process each step. Avoid making transitions too fast or too slow; balance is key to maintaining engagement.
Focus on Storytelling
Every animation should serve a purpose. Think of your map as a narrative tool. Determine whether you are showing growth, movement, or comparison. Use animations to guide your audience through that story in a logical sequence.
Test and Refine Your Slides
Before presenting, always preview your animations. This helps you identify timing issues, overlapping effects, or elements that may not appear as intended. You can use the Preview button to play animations in Normal mode, then run your slideshow to see how it might appear to the audience in sequence.
Common Mistakes to Avoid
While animated maps can be a great visual guide for the audience, small mistakes can undermine their very purpose as visual aids. Here is a list of common mistakes that you can avoid when using animations and transitions to animate maps in PowerPoint.
Overusing Animation Effects
Applying too many animations can make your presentation feel cluttered and difficult to follow. Use subtle, purposeful animations, and be mindful of the directional effects you use.
Mixing Inconsistent Styles
Using different animation types without a clear pattern can confuse viewers. Try to stick with a consistent visual language throughout your slides.
Animating Everything at Once
Revealing all elements simultaneously defeats the purpose of using animations. Stagger your effects to create a step-by-step flow. Use the Animations Pane to set the sequence for your animations to reveal information systematically. Adjust the duration of each animation to ensure slide elements are revealed gradually.
Ignoring Timing and Flow
Poor timing can disrupt the presentation. Animations that are too fast feel rushed, while overly slow transitions can lose audience attention.
Final Words
Learning how to animate a map in PowerPoint can significantly improve how you present geographic information. By using built-in animations like Fade, Wipe, Zoom, and Morph, you can turn a static map into a dynamic storytelling tool. Starting with professional templates, such as SlideModel’s PowerPoint location and map templates, can make the process easier and ensure better visual results. With a combination of structured layouts and thoughtful animations, you can create presentations that are both informative and engaging.
With practice, animated maps can become a powerful way to guide your audience through locations, routes, and insights in a clear, visually appealing way. You can use them as a storytelling tool to guide the audience through key information and make it memorable with maps and routes.