Slide 3 of 4 from Free Teamwork Infographic Template
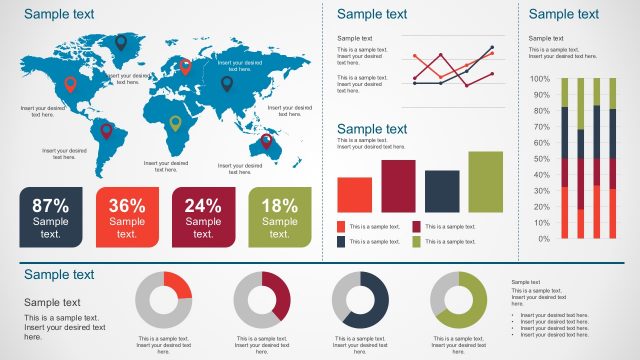
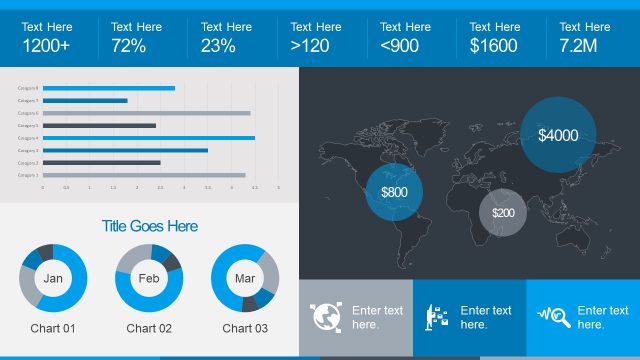
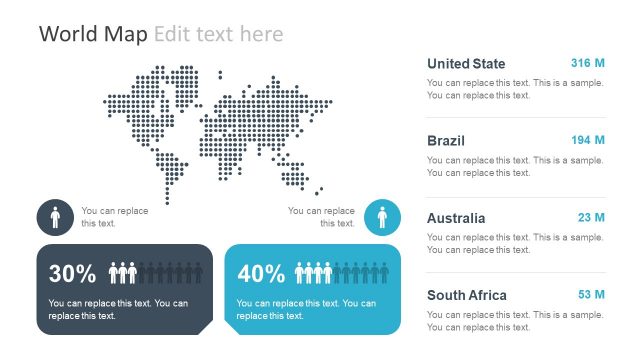
Free Global Statistics PowerPoint Infographics
Team Performance Overview Infographic
- Diagram
- Other
- Evaluation Slide
- 16:9
- 100% Editable
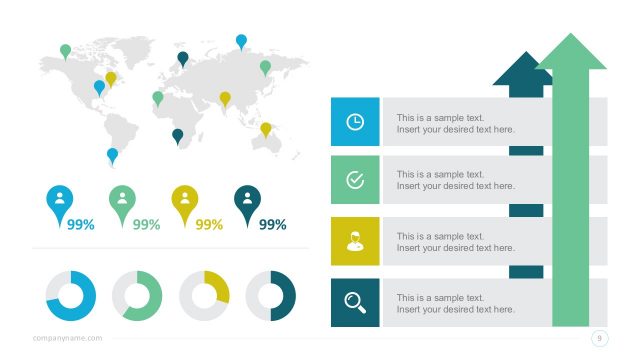
The Team Performance Overview slide from the Free Teamwork Infographic Template offers a clear layout for presenting geographical data and progress tracking. This slide template integrates editable shapes and vector icons to visualize team metrics effectively, making it suitable for business presentations and project updates within a corporate slide deck.
What’s on This Slide
The layout features a world map on the left with colored location markers indicating percentages. Below the map, there are three circular progress indicators in varying colors. To the right, a vertical column contains four text placeholders aligned in a list format, each accompanied by an icon above. The icons include a clock, checkmark, person, and magnifying glass, each in a distinct color. The overall composition is balanced, with visual elements grouped by function, creating a clear hierarchy between the map, indicators, and text sections.
How to Use It
This layout serves to present performance metrics and geographical data in a structured manner. It fits well in a presentation sequence after introducing team objectives or challenges. Ideal for showcasing team performance across different regions, it can be used in business contexts such as project updates, team assessments, or progress reports. The design allows for easy comparisons and highlights key performance indicators effectively.
Text Placeholders & Capacity
Keep your copy within these limits so it fits without resizing. Node body slots can hold about 40 characters each.
| Placeholder | Count | Max characters (approx.) |
|---|---|---|
| Item body | 4 | 40 |
| Item heading | 4 | 10 |
| Chart title | 1 | 30 |
Slide Keywords
Download unlimited PowerPoint templates, charts and graphics for your presentations with our annual plan.
DOWNLOADReturn to Free Teamwork Infographic Template.