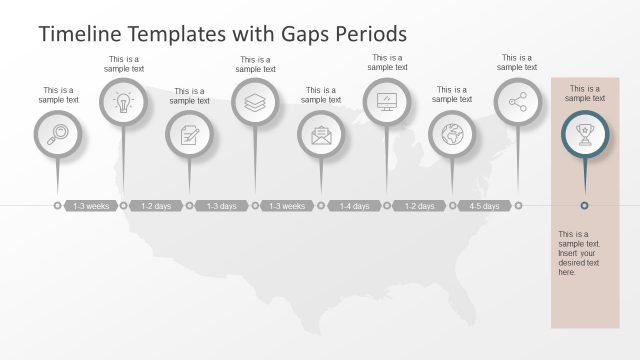
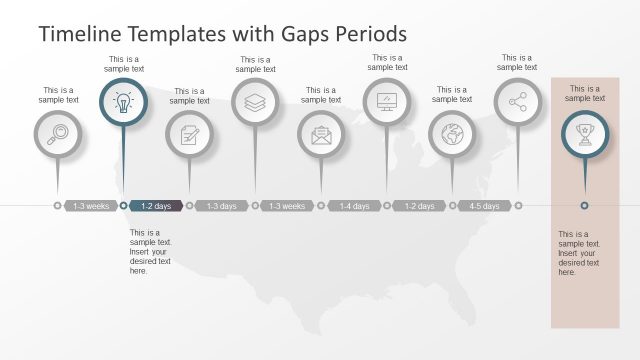
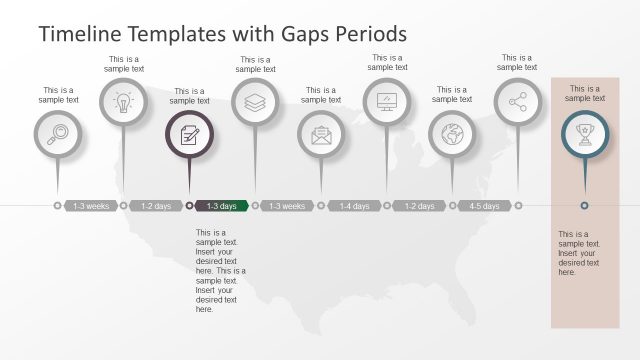
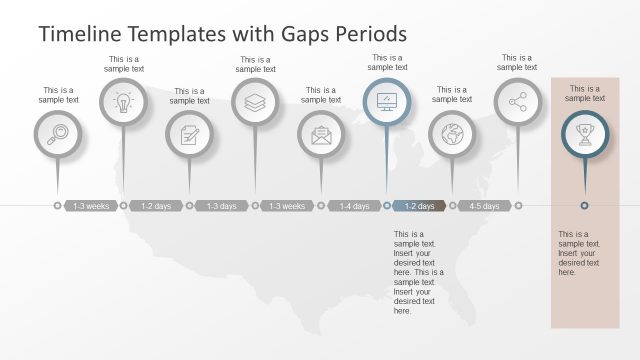
Gantt Chart Timeline Template
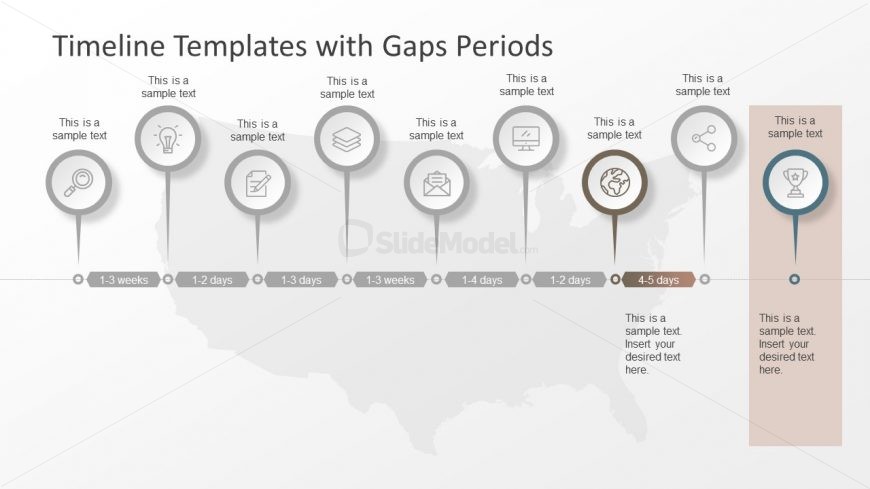
The Gantt Chart Timeline Template is a PowerPoint with gap periods to show that time of each phase. The project management team can use this template as a quick view of scheduling and resource management. Therefore, the stakeholders can easily understand the horizontal view and create an interactive mental image of phases. This slide highlights globe image insides the circular icon of location marker. The users can customize the colors using the shape fill option. Also, add animations and transitions to the slides for more engagement from audience.
Return to Timeline Templates with Gaps Periods.