Slide 1 of 5 from SWOT Analysis Infographic PowerPoint Template
Editable SWOT Analysis Infographic PPT Slide Template
SWOT Analysis Quadrant Diagram for Presentations
- Diagram
- Matrix Quadrant
- Strategic Analysis Slide
- 16:9
- 100% Editable
The SWOT Analysis Quadrant Diagram from the SWOT Analysis Infographic PowerPoint Template offers a clear, editable slide layout for strategic planning and business evaluations. This slide template features a four-quadrant matrix with distinct colored borders, ideal for presenting strengths, weaknesses, opportunities, and threats in a corporate presentation or team workshop setting. Its design supports effective communication within slide decks, making it a practical choice among presentation templates for structured strategic analysis.
What’s on This Slide
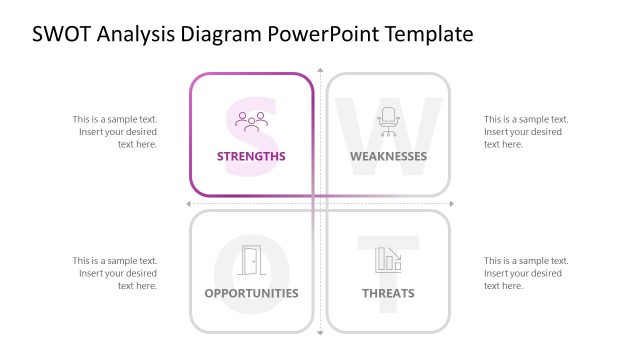
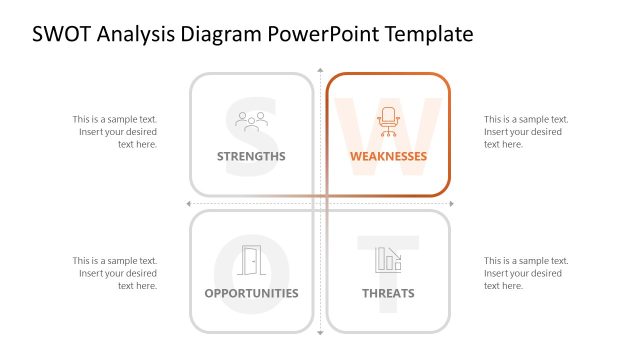
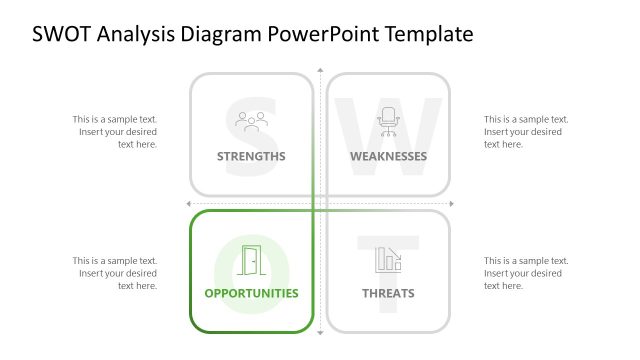
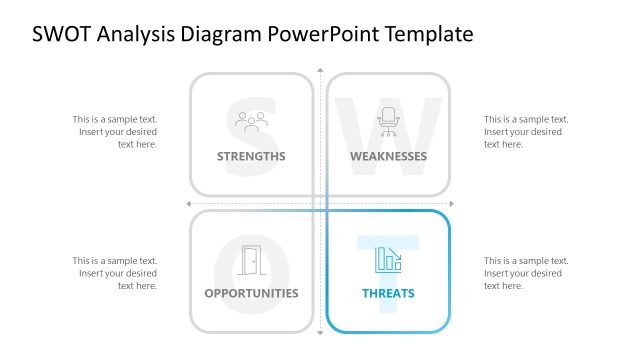
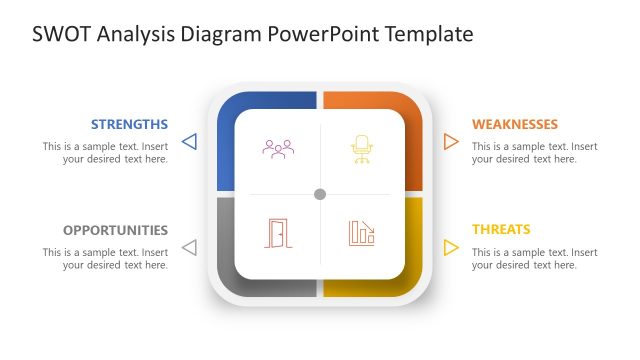
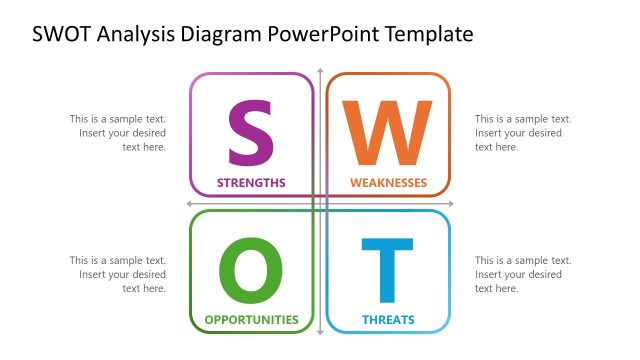
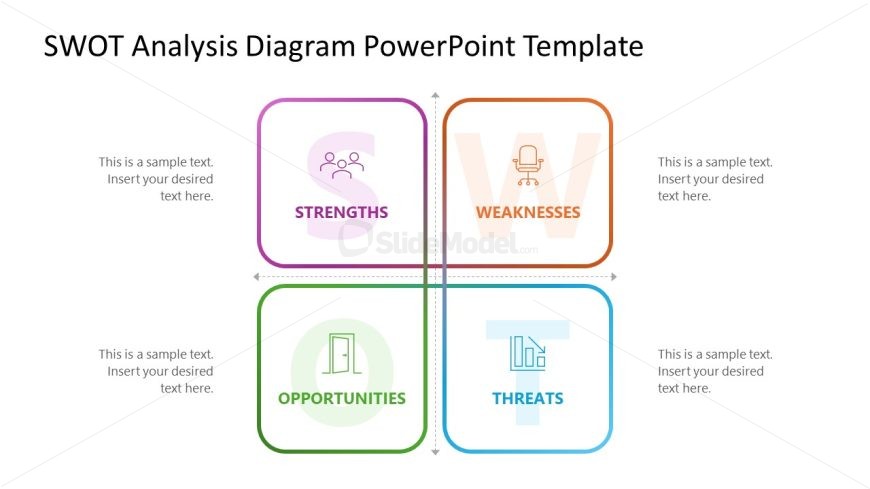
The layout features a four-quadrant diagram, each labeled with one of the SWOT categories: Strengths, Weaknesses, Opportunities, and Threats. The quadrants are arranged in a 2x2 grid, with Strengths in the top left and Weaknesses in the top right. Opportunities is in the bottom left and Threats in the bottom right. Each quadrant contains a text placeholder centered within it, allowing for alignment of content. The background is light, with distinct colors for each quadrant's border, enhancing visual separation and hierarchy.
How to Use It
This layout serves as a structured framework for presenting a SWOT analysis, ideal for strategic planning discussions. It fits early in a presentation sequence, following an introduction and problem statement. This format is useful in business meetings to summarize key internal and external factors affecting an organization. It can also be applied in workshops for brainstorming sessions or team evaluations, providing a clear visual representation of strengths, weaknesses, opportunities, and threats.
Text Placeholders & Capacity
Keep your copy within these limits so it fits without resizing. Node body slots can accommodate about 8-10 words each.
| Placeholder | Count | Max characters (approx.) |
|---|---|---|
| Item heading | 4 | 20 |
| Item body | 4 | 50 |
Slide Keywords
Download unlimited PowerPoint templates, charts and graphics for your presentations with our annual plan.
DOWNLOAD