Slide 1 of 1 from SWOT Analysis Diagram PowerPoint Template
Customizable SWOT Analysis Diagram PPT Layout
SWOT Analysis Quadrant Diagram Template
- Diagram
- Matrix Quadrant
- Strategic Analysis Slide
- 16:9
- 100% Editable
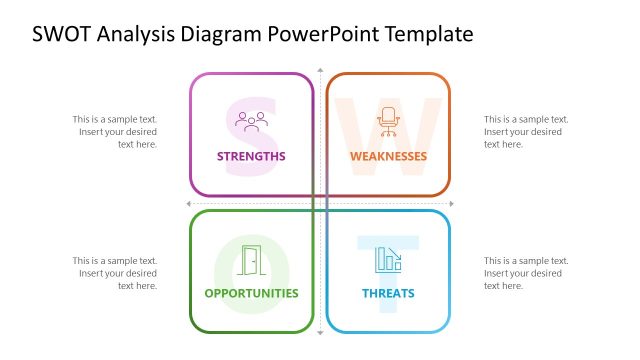
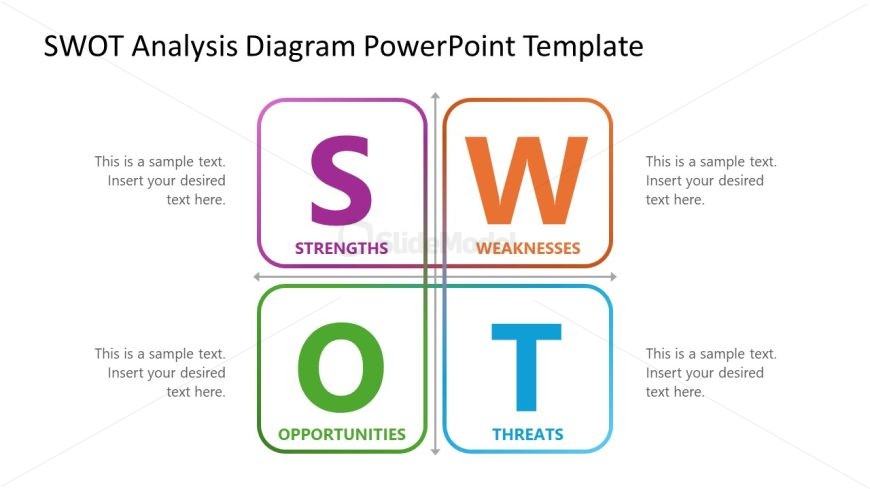
The SWOT Analysis Quadrant Diagram from the SWOT Analysis Diagram PowerPoint Template offers a clear 2x2 grid layout for strategic planning and competitive analysis. This slide template uses editable shapes and color-coded quadrants to help teams visualize strengths, weaknesses, opportunities, and threats effectively within business presentations or pitch decks.
What’s on This Slide
The layout features four quadrants arranged in a 2x2 grid. Each quadrant contains a large letter representing a SWOT category: S for Strengths, W for Weaknesses, O for Opportunities, and T for Threats. The letters are prominently displayed at the top of each quadrant, with corresponding labels below. Text placeholders are centered within each quadrant for user input. The quadrants are bordered with colored outlines: purple, orange, green, and blue. The background is white, providing contrast to the colored elements, ensuring clarity and focus.
How to Use It
This layout serves as a SWOT analysis framework, ideal for evaluating strengths, weaknesses, opportunities, and threats in a business context. It fits well in a presentation sequence following a problem statement or strategic overview. This structure is useful for strategic planning sessions, project assessments, or competitive analysis discussions, allowing teams to visualize and categorize key factors impacting their objectives effectively.
Text Placeholders & Capacity
Keep your copy within these limits so it fits without resizing. Each node body slot can accommodate roughly 15-20 words.
| Placeholder | Count | Max characters (approx.) |
|---|---|---|
| Item heading | 4 | 30 |
| Item body | 4 | 100 |
Slide Keywords
Download unlimited PowerPoint templates, charts and graphics for your presentations with our annual plan.
DOWNLOADReturn to SWOT Analysis Diagram PowerPoint Template.