Slide 10 of 13 from Strategic Overview PowerPoint Template
Resource & Investment Allocation Slide – Strategy Presentation Template
Resource & Investment Allocation Slide
- Chart
- Bar Vertical
- Resource Plan Slide
- 16:9
- 100% Editable
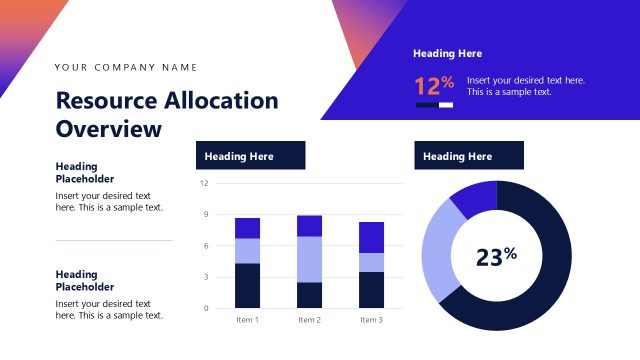
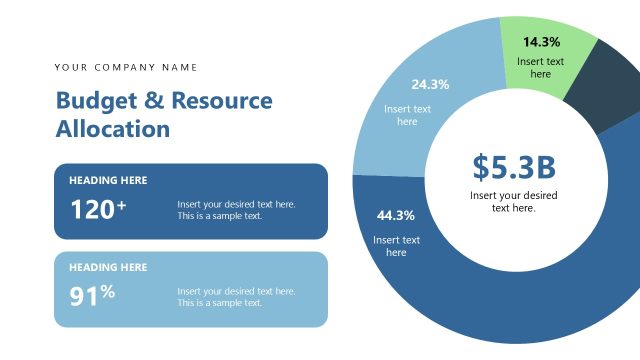
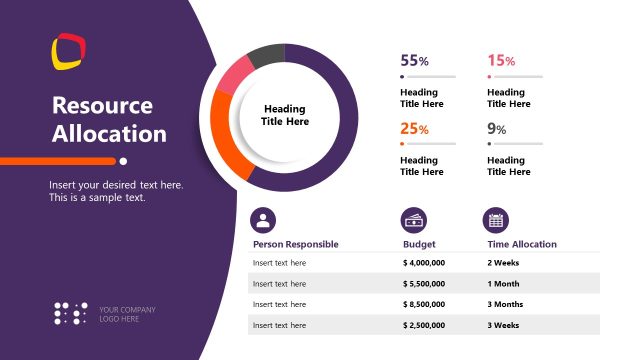
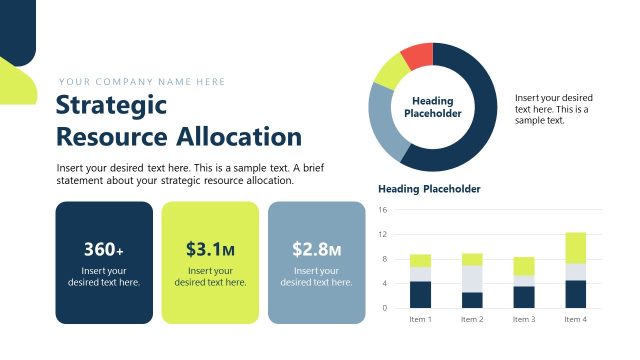
The Resource & Investment Allocation slide from the Strategic Overview PowerPoint Template offers a clear visual layout combining vertical bar charts and circular diagrams to illustrate financial resource distribution. This slide template supports business presentations and strategic planning by providing editable slides that highlight investment proposals with distinct color-coded segments and data visualization, enhancing decision-making in corporate presentations.
What’s on This Slide
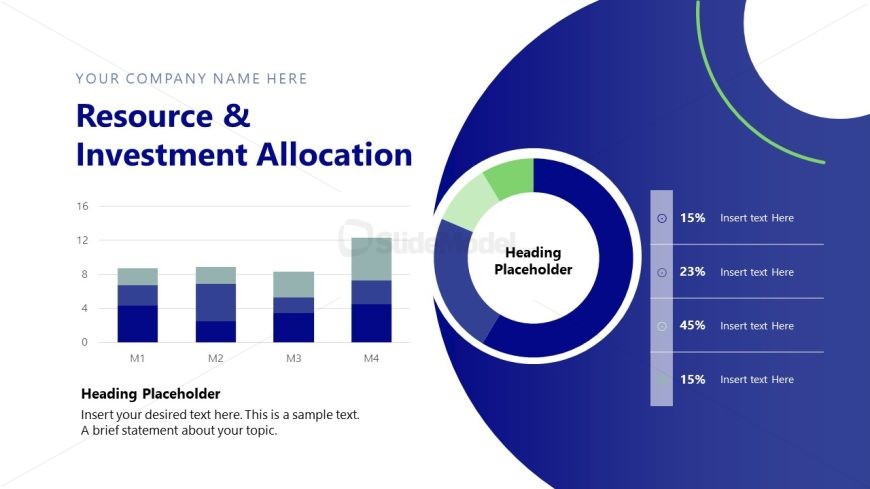
The layout features a left-aligned bar chart with four vertical bars representing values for M1 to M4, each with distinct color segments. To the right, a circular diagram displays three segments with percentages labeled 15%, 23%, and 45%, along with a central placeholder for additional text. The background is a gradient of blue tones, enhancing visual separation. Text placeholders are positioned at the top and bottom, with the main title prominently displayed at the top. The overall composition balances graphical and textual elements effectively.
How to Use It
This layout serves to present resource allocation and investment distribution visually. It is suitable for financial presentations, strategic planning sessions, or investment proposals. Positioned after problem identification slides, it effectively communicates how resources will be allocated to address identified issues. This slide can be used in business contexts where clear visual representation of data is essential for decision-making.
Text Placeholders & Capacity
Keep your copy within these limits so it fits without resizing. Body slots can hold around 15 words each.
| Placeholder | Count | Max characters (approx.) |
|---|---|---|
| Slide title | 1 | 30 |
| Item body | 3 | 20 |
| Item body | 1 | 20 |
| Body paragraph | 1 | 100 |
Slide Keywords
Download unlimited PowerPoint templates, charts and graphics for your presentations with our annual plan.
DOWNLOADReturn to Strategic Overview PowerPoint Template.