Bi-Modal Diagram Present Two Peaks
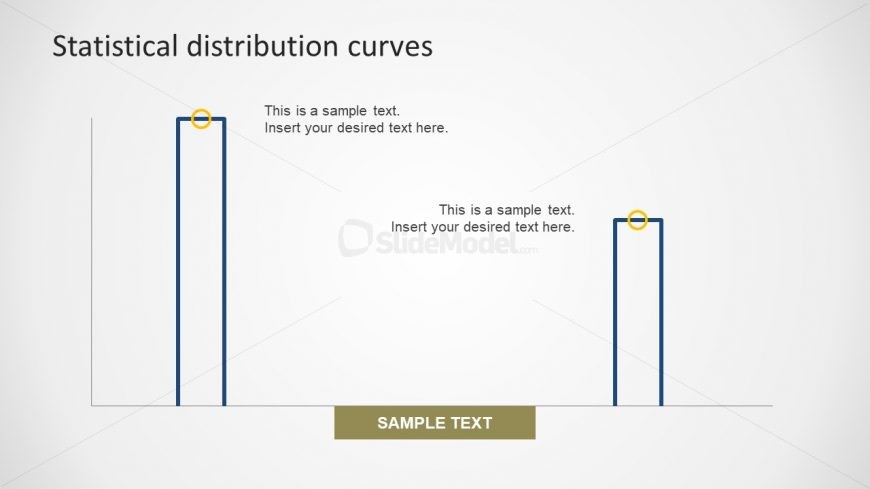
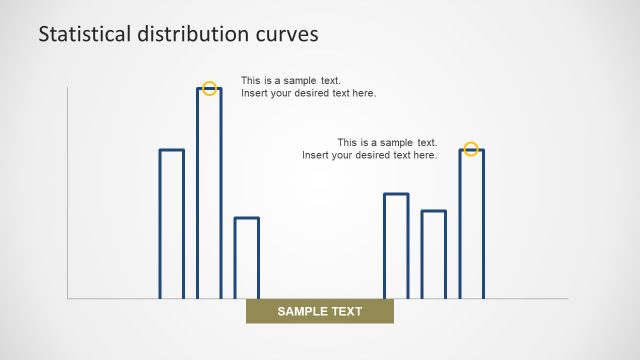
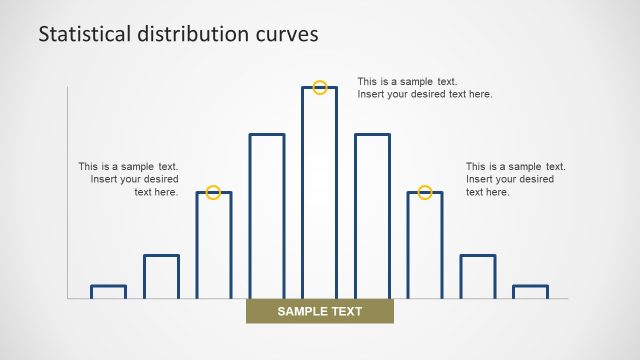
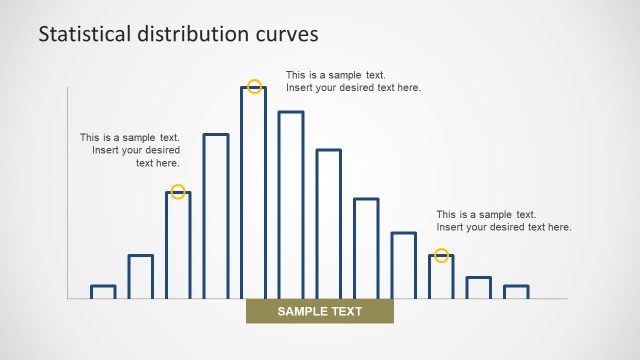
The two-bar chart slide of Bi-Modal Diagram Present Two Peaks on corners of graph template. The two peaks of graph indicate two types of considerations. There are two outcomes from processes, together to create a blend of distribution. For example, in exam, there are two grades with maximum peak, i.e. A and D. It shows the two types of students in a group. This bimodal distribution chart template lets users increase or decrease the size of bars by changing the values. Or, use mouse drag and drop function to adjust the bars.
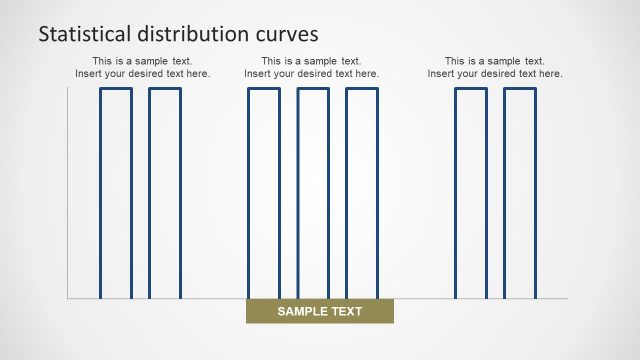
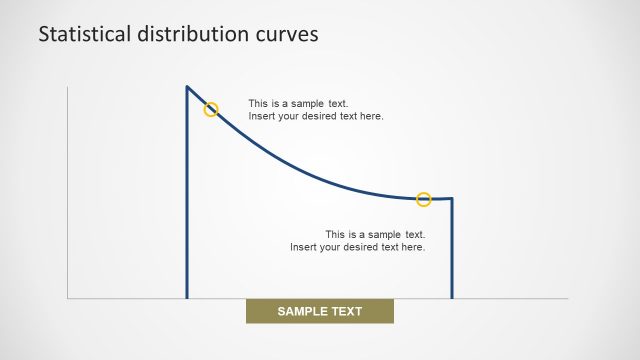
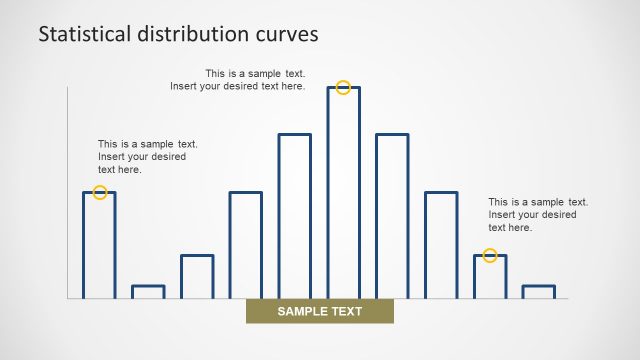
Return to Statistical Distribution PowerPoint Curves.