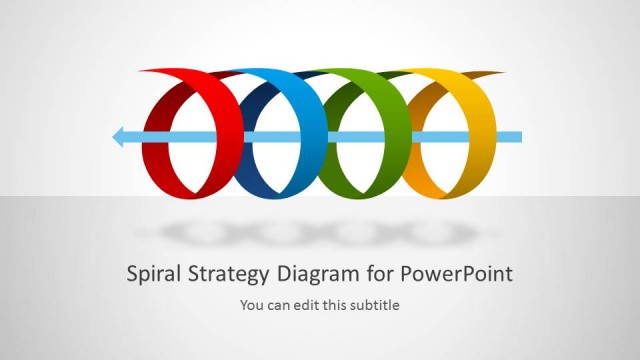
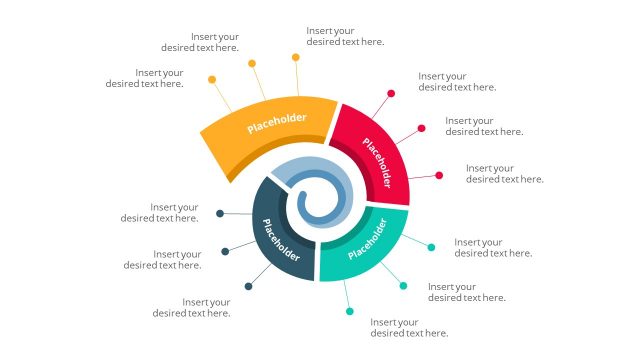
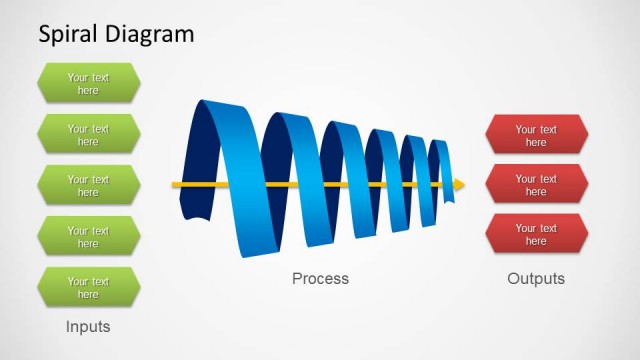
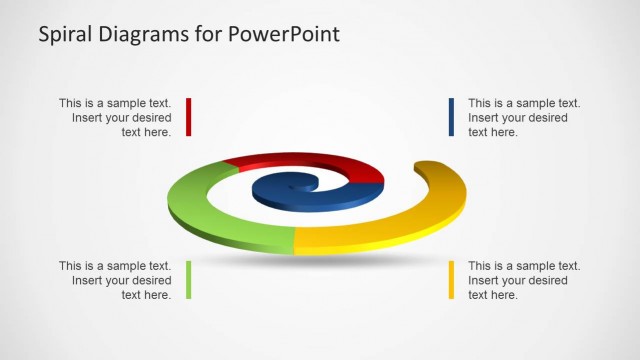
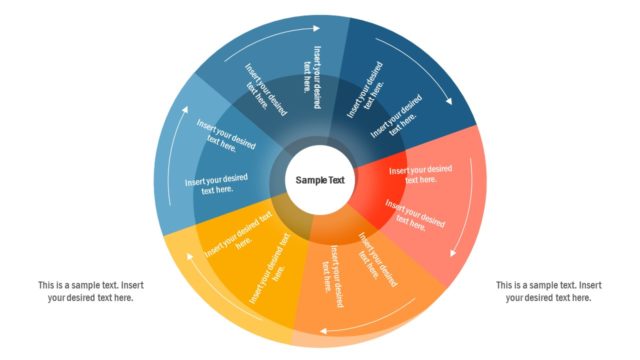
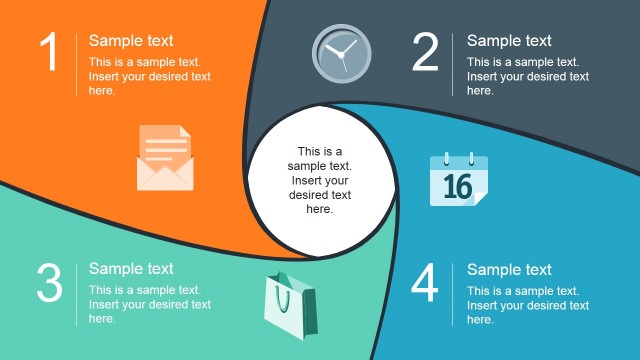
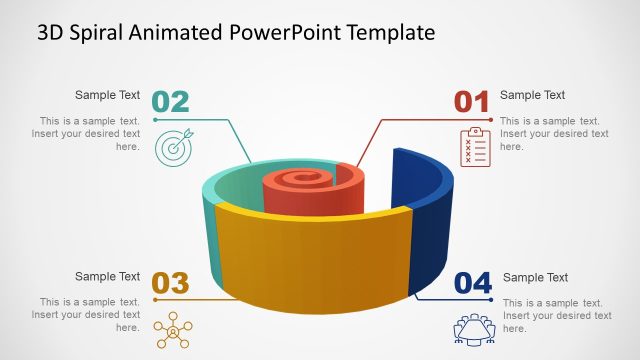
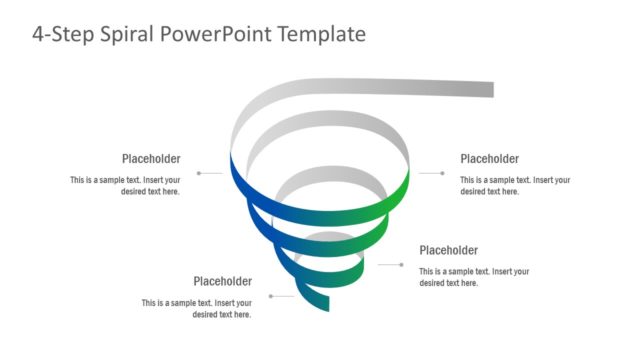
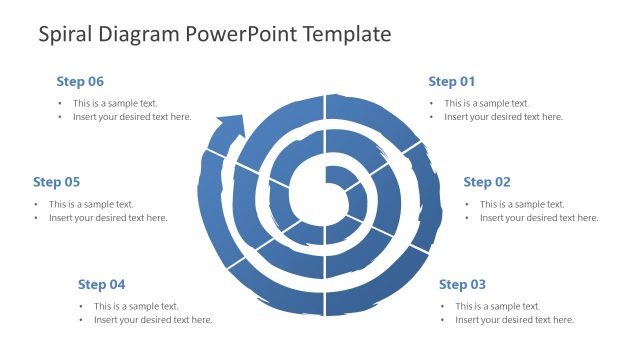
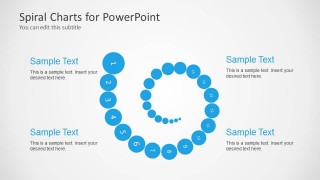
Spiral Chart Diagram for PowerPoint is a template for making circular, cycle and spiral diagrams using elegant spiral shapes.
With expertly crafted slides, you can easily create models for showing a specific type of process, as well as display complicated processes with the help of easy to grasp diagrams.
The spiral PowerPoint template is customizable enough to allow users to edit each sample slide, including the shape, color and size of slide elements.
What’s inside this template
Example presentation scenarios
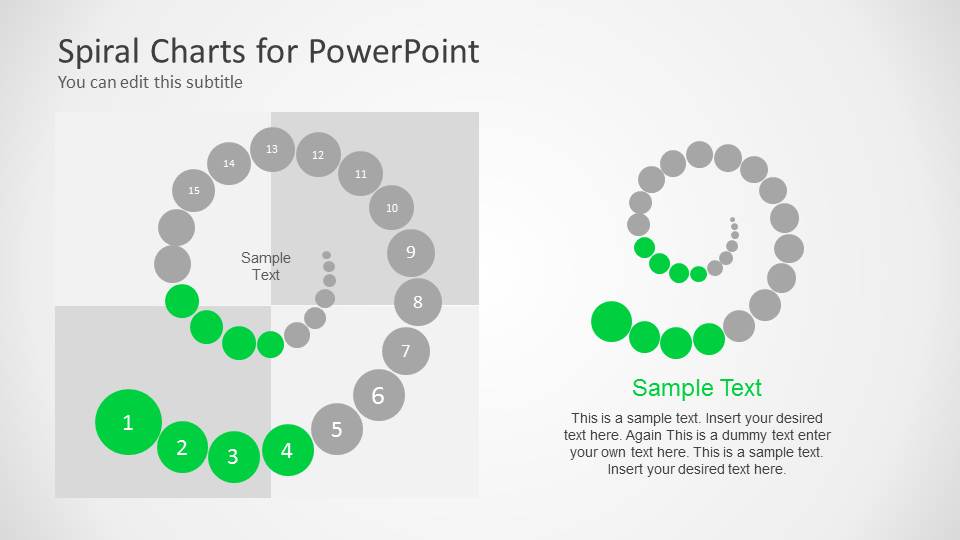
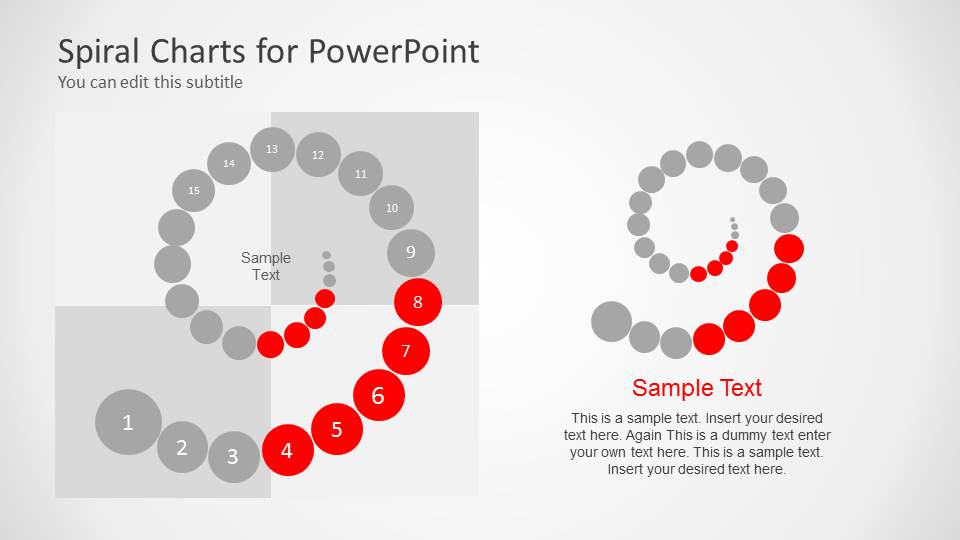
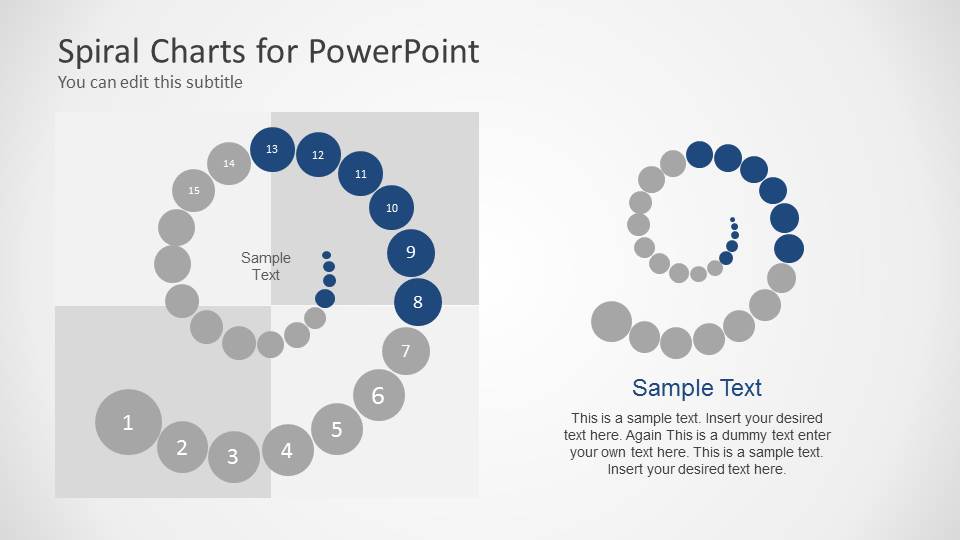
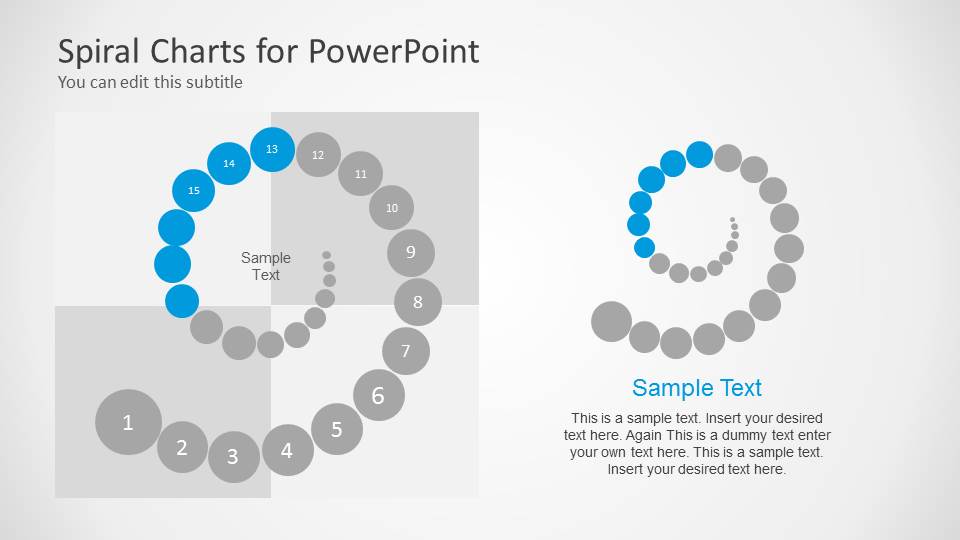
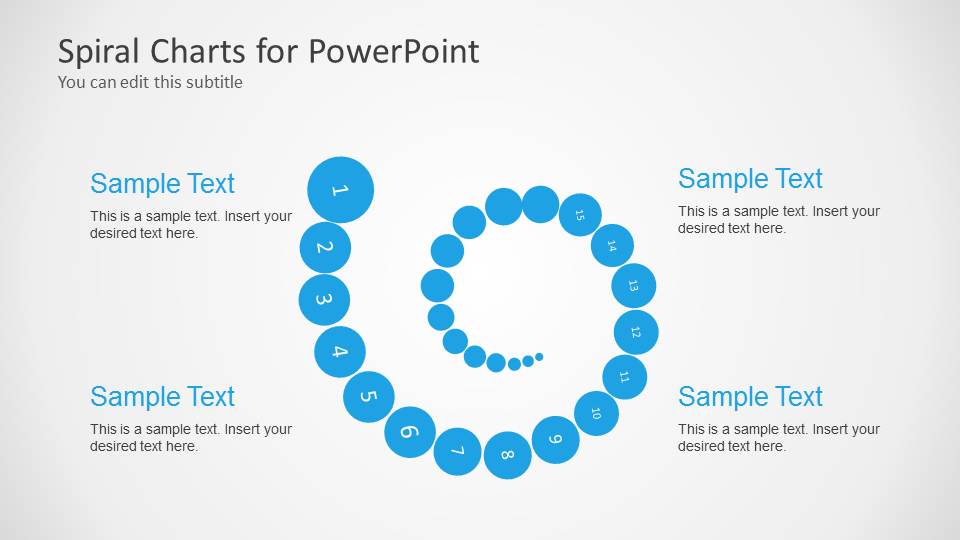
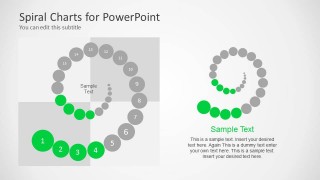
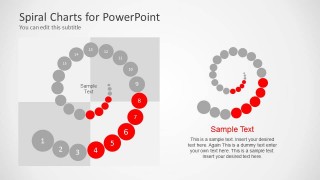
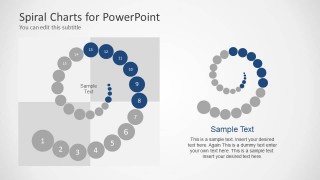
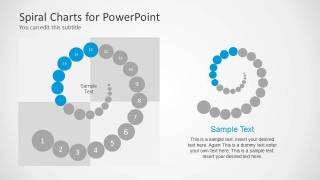
- A project manager can explain an implementation cycle by using the numbered spiral overview to show step order and the highlighted segment slides to discuss specific phases.
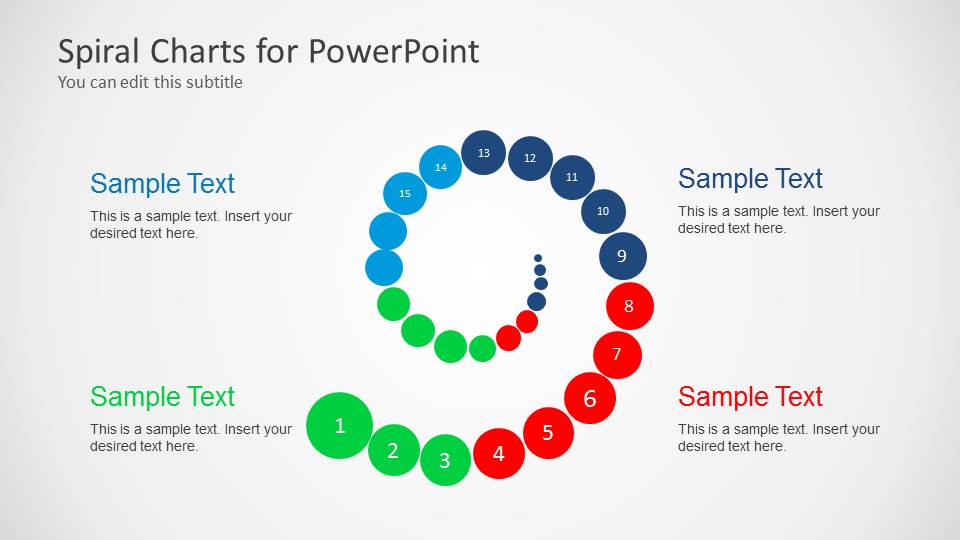
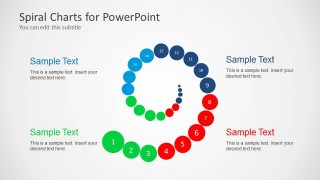
- A product manager can present a product lifecycle to executives with the four-callout spiral, linking each text block to a visible portion of the process path.
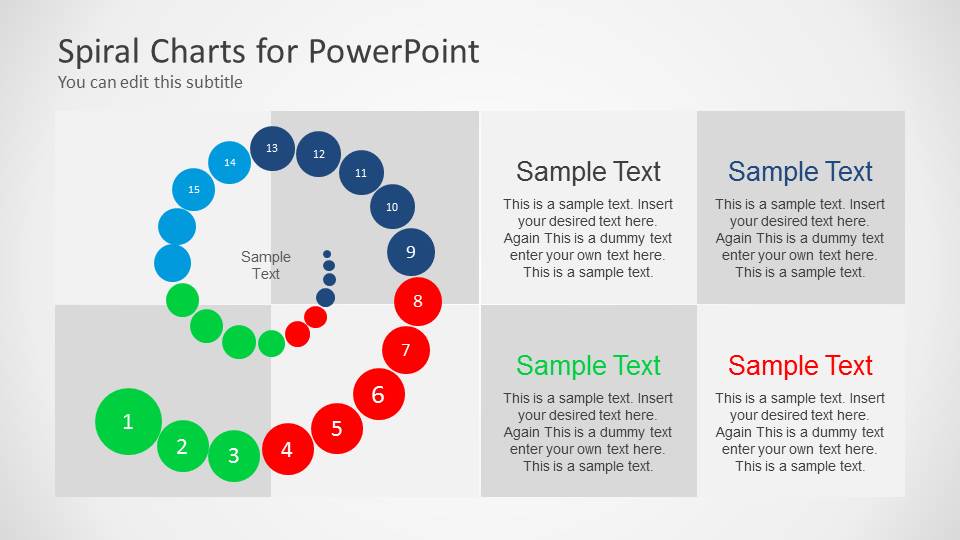
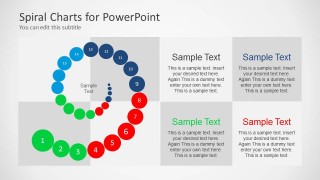
- A consultant can teach a maturity model to a client team by using the four-panel grid slide to group the spiral stages into broader capability areas.
- A training facilitator can walk learners through a repeatable workflow by using the single-color numbered spiral as the main reference and adding supporting notes in the surrounding callouts.
Features
- 100% editable presentation template
- Compatible with Microsoft PowerPoint and Google Slides
- 16:9 aspect ratio slides
- Scalable vector shapes, icons and illustrations
- AI-Ready for Microsoft Copilot and Claude
- Instant access and download
Frequently asked questions
Q: How should a presenter explain a spiral process without making the audience lose track of the sequence?
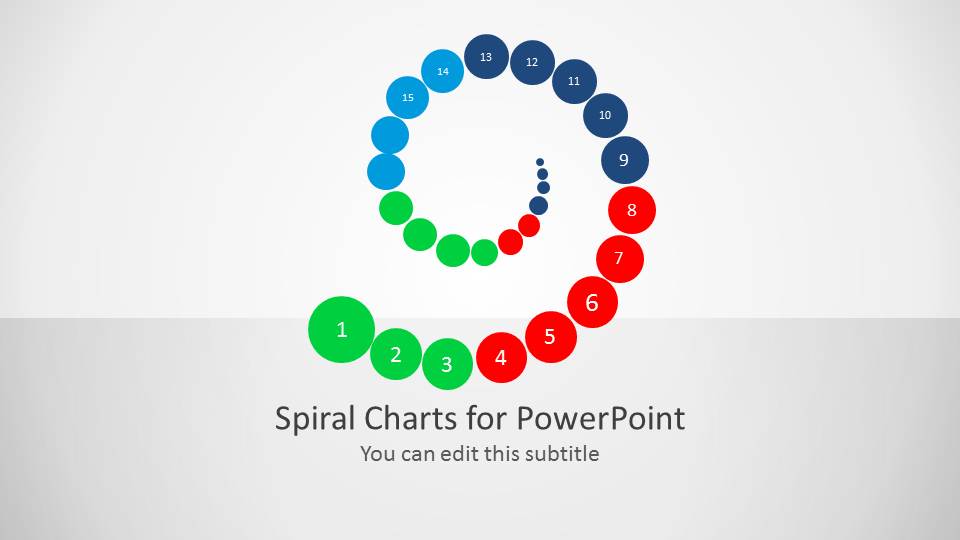
A: Start with the full numbered spiral so the audience understands the overall path. Then move to the highlighted segment slides to focus attention on one colored stage group at a time. Keep each callout short and tie the text back to the visible numbered circles, so the sequence remains anchored throughout the explanation.
Q: Who is this template best suited for, and what message does it communicate best?
A: This template works best for consultants, project leads, product managers, and trainers who need to explain a staged process that repeats, grows, or loops inward. The spiral format is stronger than a standard timeline when the message is about iteration, maturity, cyclical progress, or a phased workflow that returns to earlier learning.
Q: Why use a spiral metaphor instead of a straight process diagram?
A: The spiral metaphor signals movement, continuation, and staged development while still preserving a clear numbered order. The colored segment variations help presenters isolate a phase without redrawing the process. This makes the design useful for explaining cycles, feedback loops, or growth paths where progress is sequential but not simply linear.
Spiral Chart Diagram for PowerPoint
8-slide presentation template with numbered spiral diagram layouts for cycle processes and phased sequences
Spiral Chart Diagram for PowerPoint is an 8-slide diagram template for Microsoft PowerPoint and Google Slides. It includes a cover spiral, four-callout spiral, four-panel grid, highlighted segment spirals, and a single-color numbered spiral for presenting cycles, phased processes, product stages, or iterative workflows.
- Category
- Diagrams
- Rating


 Loading...
- Aspect ratio
- 16:9
- Item ID
- 6101-01
- Colors
 Microsoft PowerPoint
  Microsoft Copilot
  Claude for PowerPoint
 Other formats supported
Subscribe today and get immediate
access to download our PowerPoint templates.