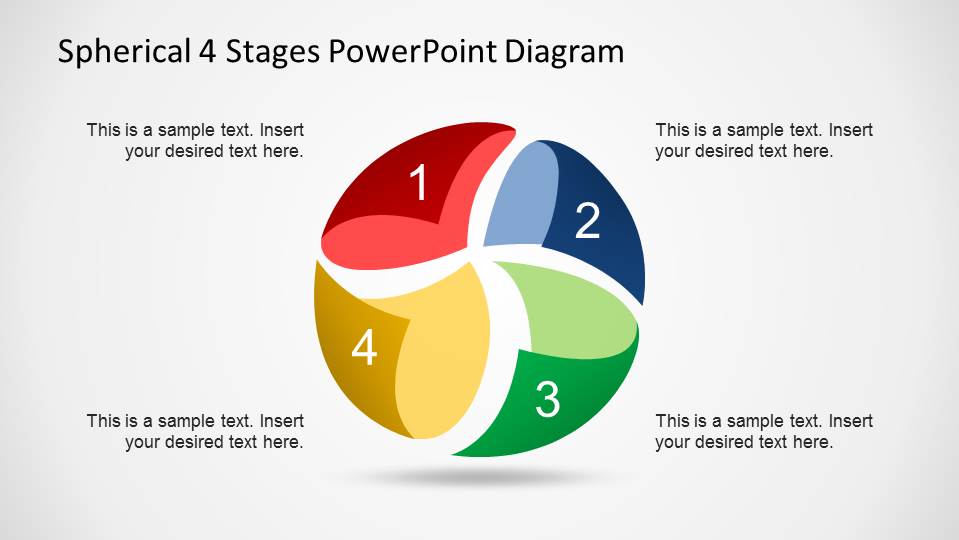
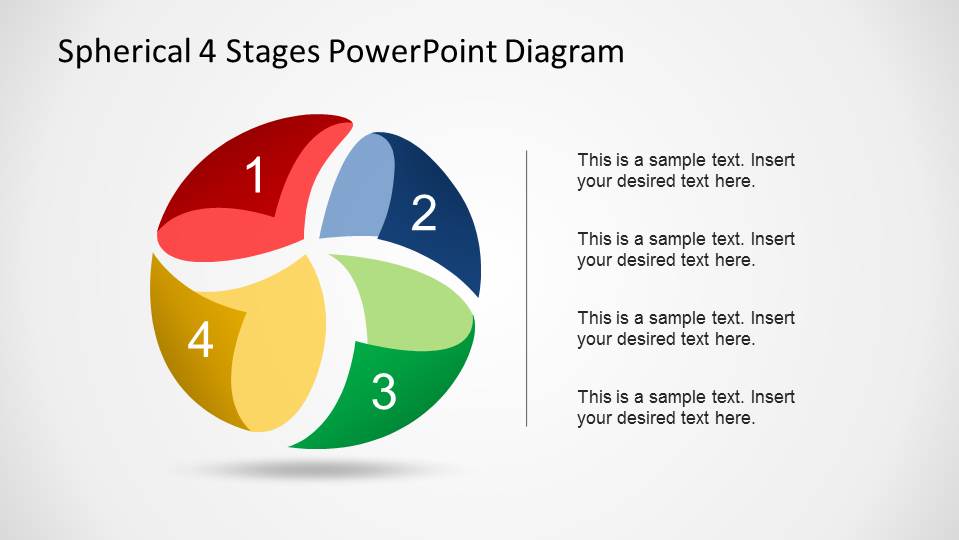
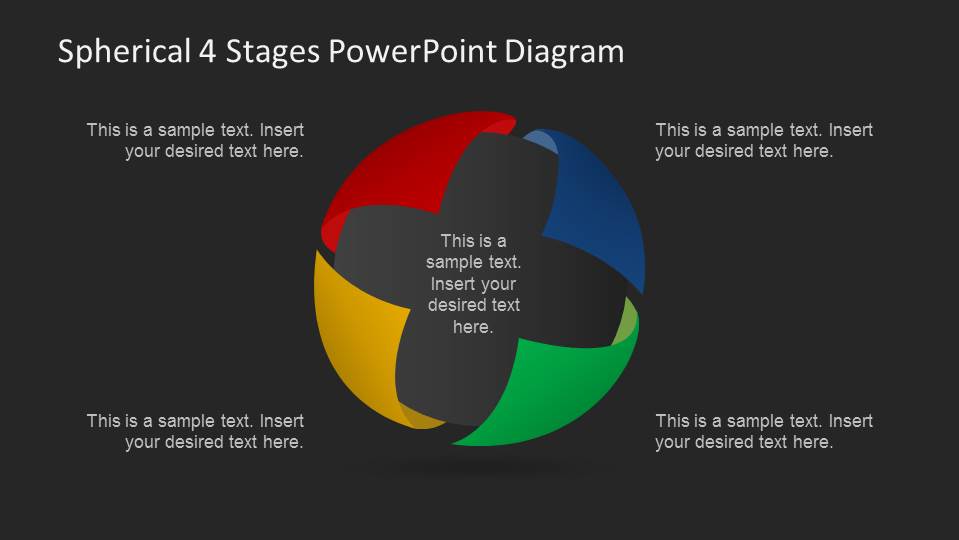
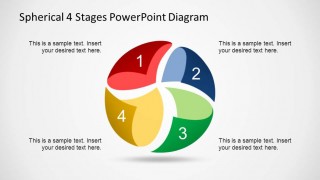
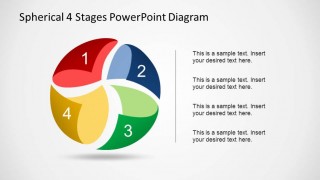
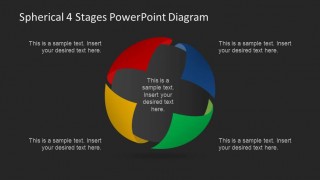
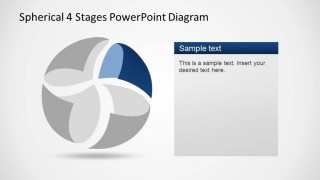
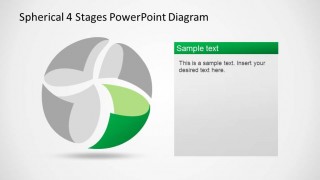
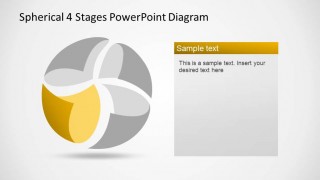
Spherical 4 Stages PowerPoint Diagram is a sophisticated 3D Diagram with 4 wedges simulating being part of a sphere. This PowerPoint Diagram is very flexible. It can be used as a SWOT Diagram, creating your own personal swot analysis PowerPoint, or for contributing factors analysis. Each piece of this creative PowerPoint diagram is designed as PowerPoint objects, allowing the user to fully customize each shapes properties. The diagram comes in two themes, white background and dark background.
Presenters can describe spherical coordinates through the diagram or create simple polar coordinates representations. Complement the Spherical 4 Stages PowerPoint Diagram with any of our Curves and Statistical shapes and create amusing geometries to improve your message.
Create appealing Staged Diagrams presentations that engage global audiences with our top of the line 3D PowerPoint Templates to make professional PowerPoint designs.
What’s inside this template
Example presentation scenarios
- A strategy consultant can use the numbered four-segment sphere to introduce a SWOT-style framework and show how each quadrant contributes to one business conclusion.
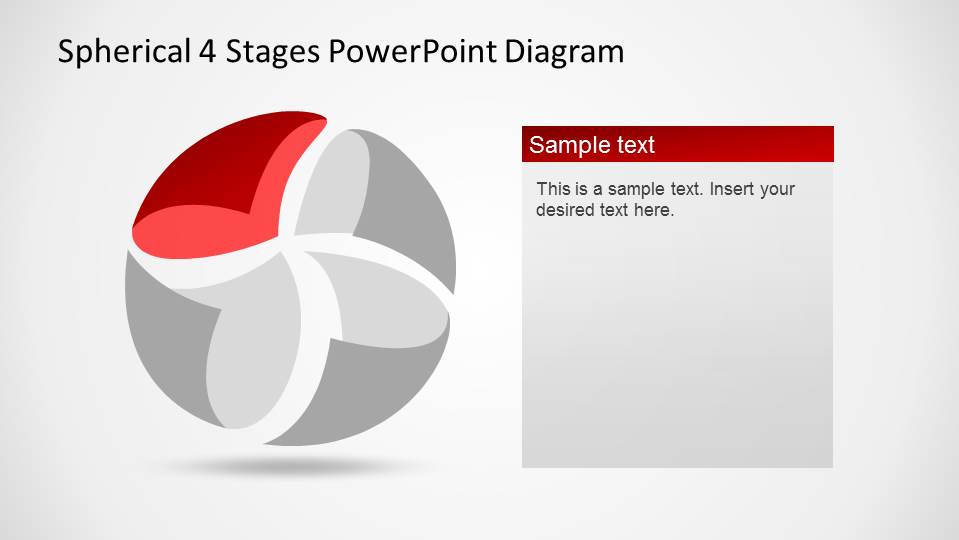
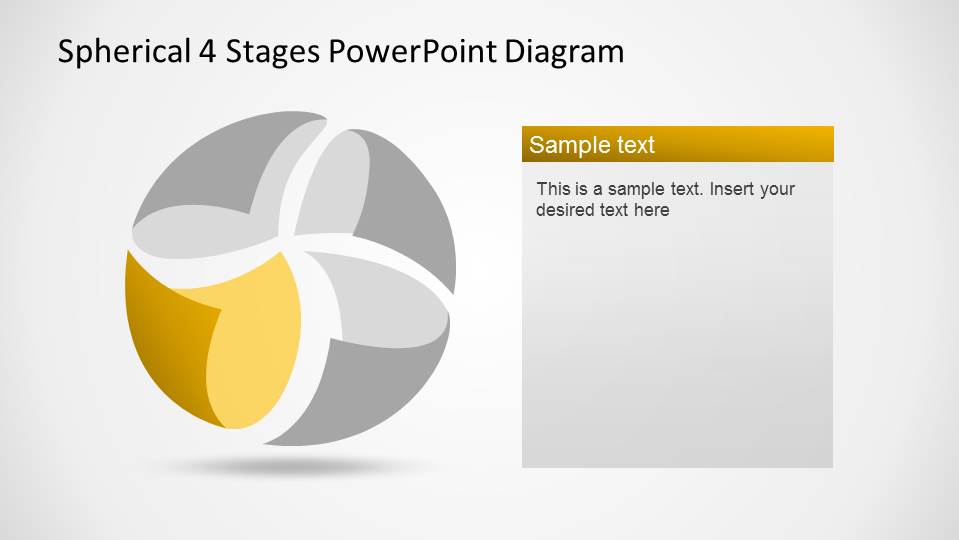
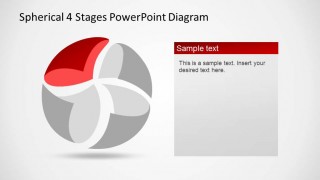
- A project manager can use the single-segment callout slides to walk stakeholders through four stages of an initiative without overcrowding the overview diagram.
- A business analyst can use the side text panel layout to explain contributing factors, risks, drivers, or dependencies in a structured executive briefing.
- A training facilitator can use the dark-background sphere as a visual discussion prompt when teaching how four connected concepts form one complete model.
Features
- 100% editable presentation template
- Compatible with Microsoft PowerPoint
- 16:9 aspect ratio slides
- Scalable vector shapes, icons and illustrations
- AI-Ready for Microsoft Copilot and Claude
- Instant access and download
Frequently asked questions
Q: How should a presenter explain the four spherical segments without making the diagram feel abstract?
A: Start with Slide 1 or Slide 2 to define the full model, then assign a clear meaning to each colored wedge before discussing details. Keep the labels short and use the surrounding text boxes for consequences, examples, or action items. The segment focus slides help slow the discussion and prevent the audience from reading all four areas at once.
Q: Who is this template best suited for in a business presentation?
A: This template fits consultants, analysts, managers, and facilitators who need to explain four forces that combine into one result. It works well for SWOT-style planning, contributing factor analysis, process stages, capability models, or risk categories where the message is about interdependence rather than a linear path.
Q: Why use a spherical four-stage diagram instead of a standard quadrant or list?
A: The sphere metaphor makes the four parts feel connected as one system, not four isolated bullets. The curved wedges imply balance, contribution, and shared structure. By pairing the full sphere with individual segment slides, the deck supports both big-picture orientation and focused discussion of each factor.


Spherical 4 Stages PowerPoint Diagram
7-slide PowerPoint diagram template with spherical 4-stage process and SWOT-style segment callouts
Spherical 4 Stages PowerPoint Diagram is a 7-slide Microsoft PowerPoint template for explaining four related factors. It includes a numbered four-part spherical diagram, a dark-background version, isolated segment callout slides, and side text panels. The design suits SWOT, contributing factor analysis, staged processes, and circular comparisons.
- Category
- Diagrams
- Rating


 Loading...
- Aspect ratio
- 16:9
- Item ID
- 6501-01
- Colors
 Microsoft PowerPoint
  Microsoft Copilot
  Claude for PowerPoint
 Other formats supported
Subscribe today and get immediate
access to download our PowerPoint templates.