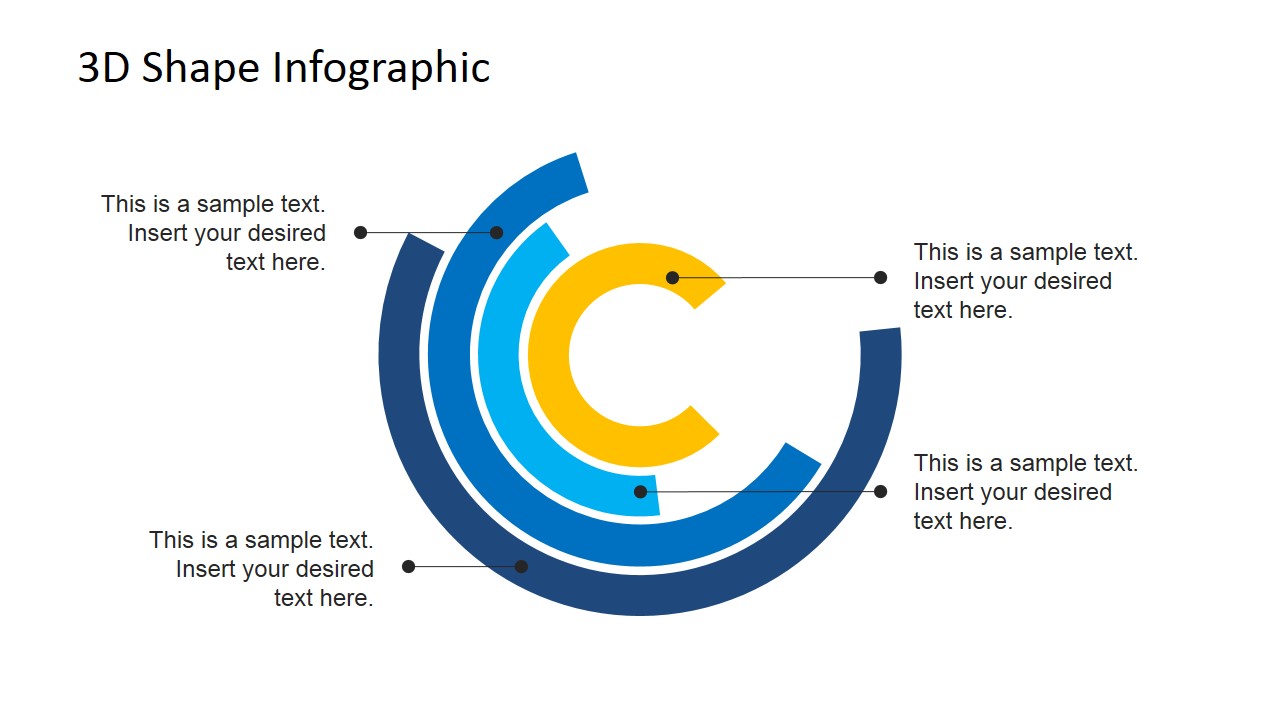
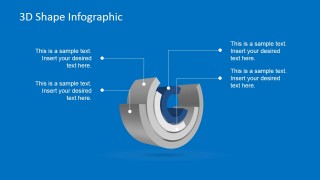
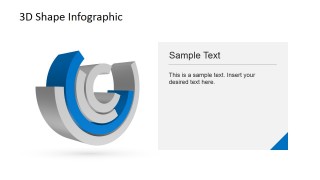
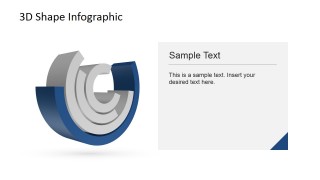
Tihs Modern 3D Cylindrical 4 Layers PowerPoint Diagram is a layered design featuring a concentric 3D cylindrical shape. Each layer of this template has been segmented to resemble a pie chart. It is ideally used as a comparison slide to represent a comparison chart table in your presentations, or like a Staged Process Diagram, or as a Circular model.
Each step is described through the subsequent levels of the template’s layers. This Shapes are created entirely with PowerPoint objects, allowing the user to customize fully its appearance.Properties as its size, colour and effects can be edited without losing any of the original quality.
One of the major advantages of the Modern 3D Cylindrical 4 Layers PPT diagram is found in the ease of use. The design map four step processes and indicate to your audience the concentric relationship between articles. Similar to a core diagram, the concentric nature of the cylinders provides the metaphor of one concept within the other.
Another practical application of the Modern 3D Cylindrical 4 Layers slide template design is to explain the relationships between four given concepts within the same context. For example, one might use the template for marketing purposes to indicate the multi-layered nature of SEO when used for categorizing audiences. From outside to inside:
- General content audience
- Specific email audience
- First time customers and clients
- Returning customers and clients
The PowerPoint shapes use 3D effects and the theme is configured with the default color palette. This features works in all PowerPoint versions, including Office 365 Web applications. The template can be imported and edited in Google Slides.
This modern 3D cylindrical PPT template can be useful to create infographics and dashboards in PowerPoint. Presenters can make data presentations with complex information summarized through stunning graphics. Users can combine the expressiveness of diagrams with the beauty of icons, which are create for visual learners.
The 3D cylinder PPT template is compatible with PowerPoint & Google Slides presentations.
What’s inside this template
Example presentation scenarios
- A consultant can use the concentric cylinder callout slides to explain four levels of a business model and show how each layer relates to a shared core idea.
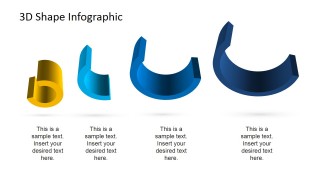
- A marketing manager can use the four-step segmented cylinder sequence to present audience tiers, campaign layers, or funnel-related segments in a compact visual form.
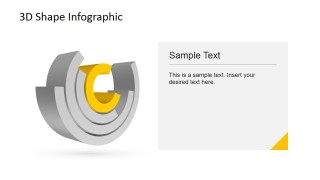
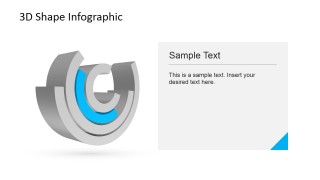
- An operations presenter can use the two-column highlighted-layer slides to isolate one process stage at a time while keeping the full four-layer structure visible.
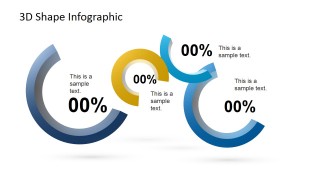
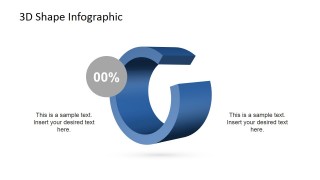
- An analyst can use the KPI-style donut slide to discuss circular percentage indicators while adding short context beside each ring.
Features
- 100% editable presentation template
- Compatible with Microsoft PowerPoint and Google Slides
- 16:9 aspect ratio slides
- Scalable vector shapes, icons and illustrations
- AI-Ready for Microsoft Copilot and Claude
- Instant access and download
Frequently asked questions
Q: How should a presenter explain the four-layer model without making the 3D diagram feel decorative?
A: Start with the complete cylinder view to define the whole model, then move to the highlighted-layer slides to explain one ring at a time. Keep each callout short and assign one clear meaning to each layer. The final segmented sequence works well as a recap because it separates the four parts after the audience has seen the nested structure.
Q: When is this template a better choice than a standard process chart or quadrant diagram?
A: Choose it when the message depends on containment, depth, or nested priority rather than a simple left-to-right flow. Consultants, marketers, and strategy teams can use the cylinder to show core-to-outer-layer relationships, audience tiers, product architecture, or capability levels where each part surrounds or builds on another.
Q: Why use a concentric 3D cylinder metaphor for business communication?
A: The cylinder gives the audience a visual cue that the ideas are connected around a common center. The 3D depth suggests layers, not just categories. Because several slides isolate a single colored ring against gray rings, the design helps presenters shift attention while preserving the context of the full model.



Modern 3D Cylindrical 4 Layers PowerPoint Diagram
10-slide presentation template with 3D cylinder layers, concentric circles, and KPI-style donut visuals
Modern 3D Cylindrical 4 Layers PowerPoint Diagram is a 10-slide diagram template for explaining layered concepts, segmented processes, and KPI-style percentages. It includes a 3D cylindrical concentric circle diagram, callout layouts, percentage donut infographic, and four-step segmented cylinder sequence for Microsoft PowerPoint and Google Slides.
- Category
- Shapes
- Rating


 Loading...
- Aspect ratio
- 16:9, 4:3
- Item ID
- 6714-01
- Colors
 Microsoft PowerPoint
 Microsoft Copilot
 Claude for PowerPoint
Other formats supported
Subscribe today and get immediate
access to download our PowerPoint templates.