Shoelaces Diagram Concept for PowerPoint is a presentation template with a shoelaces metaphor design. It can be used as an alternative to other presentation designs like the spaghetti diagram to model a complex flow, a confusing scenario or as a visual representation of a continuous flow line modeling an activity through a process with different inputs and outputs.
How can you use this design? The shoelaces diagram can be used to represent complexity and correlation of ideas while presenting a topic or business concept. Also, this shoelaces design can be used to represent the similarity or likeness of different concepts with laces tie together.
What’s inside this template
Example presentation scenarios
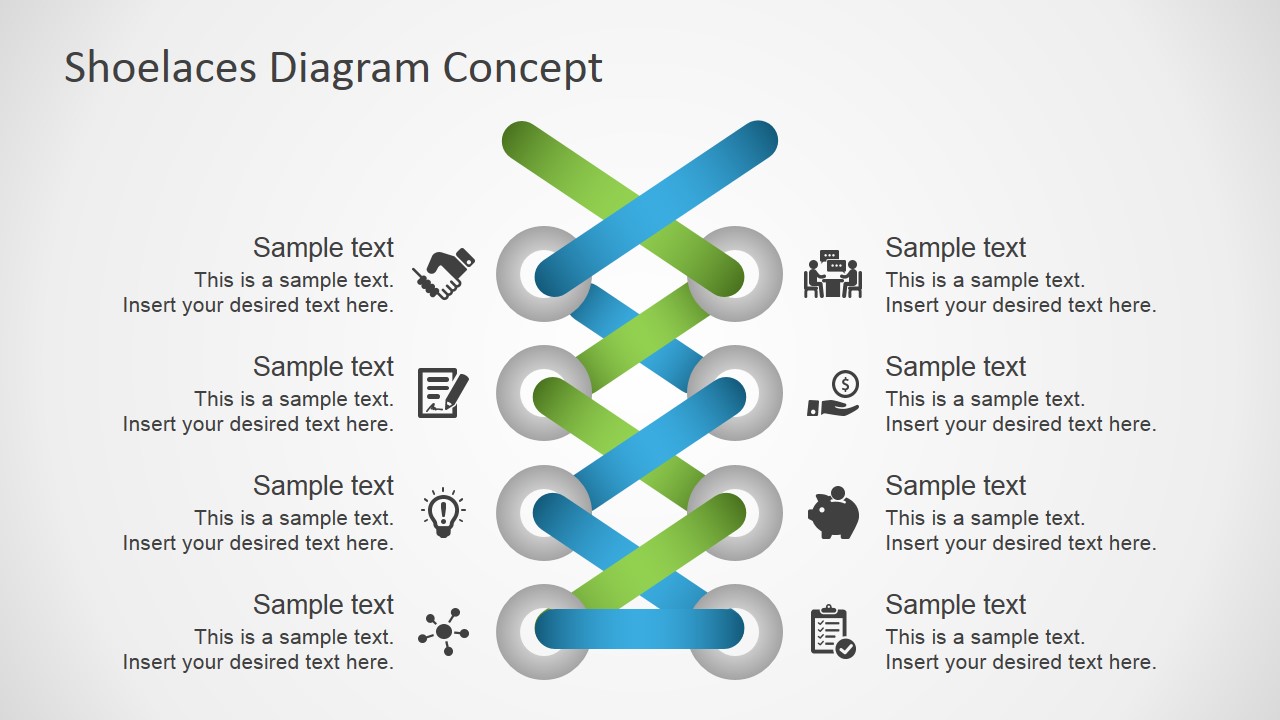
- A consultant can use the eight-callout shoelace diagram to explain how stakeholder concerns, constraints, and dependencies are tied into one client problem.
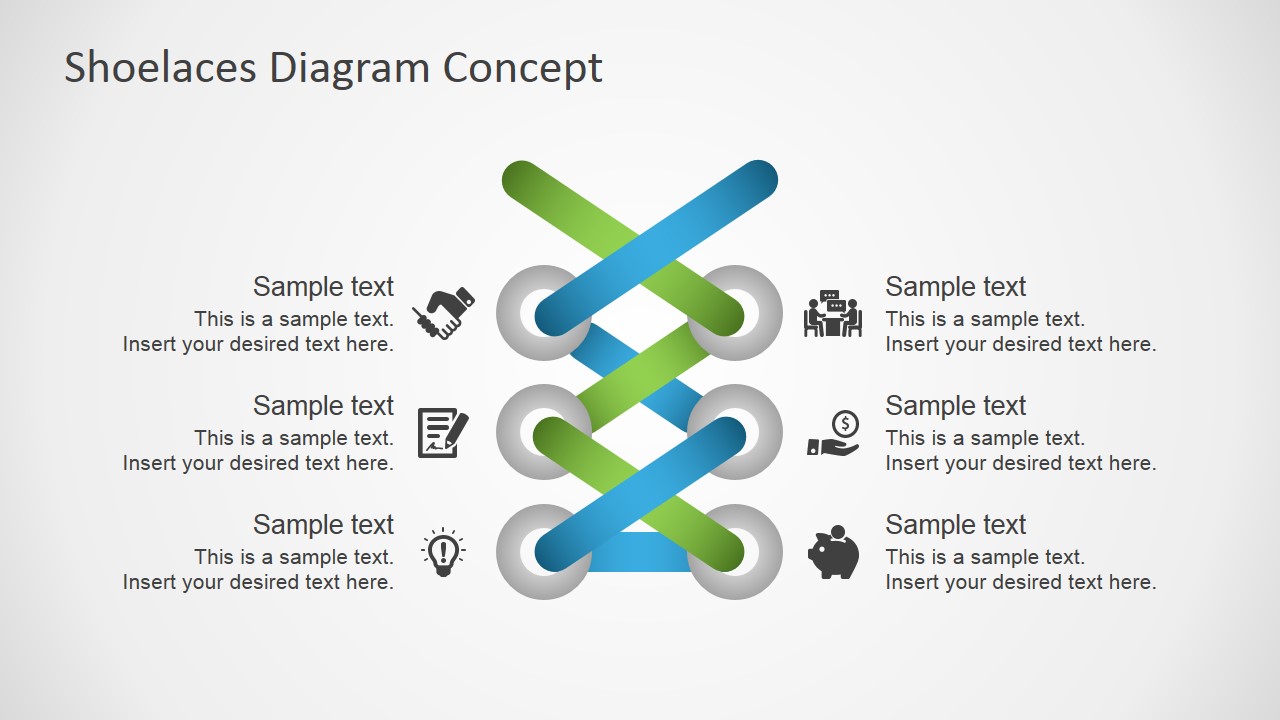
- A project manager can use the six-callout layout to show how workstreams on both sides of a project connect through shared decisions or handoffs.
- A product manager can use the four-callout slide to compare two related concepts and show why they should be discussed together.
- A strategy presenter can use the laced path metaphor to introduce a knotty business issue before moving into a separate solution or recommendation deck.
Features
- 100% editable presentation template
- Compatible with Microsoft PowerPoint and Google Slides
- Scalable vector shapes, icons and illustrations
- AI-Ready for Microsoft Copilot and Claude
- Instant access and download
Frequently asked questions
Q: How should I present a complex issue with this shoelaces metaphor without confusing the audience?
A: Start by naming the central problem in the slide title, then treat each side callout as one tied factor rather than as a long explanation. Use the eight-callout slide for a full problem map, then switch to the six-callout or four-callout version when the discussion needs a clearer executive summary.
Q: Who is this template best suited for in a business presentation?
A: This template fits presenters who need to explain relationships that are connected but not strictly sequential. Consultants, project managers, business analysts, and product teams can use the laced diagrams to discuss dependencies, similarities, tradeoffs, or process inputs before presenting recommendations, decisions, or next steps.
Q: Why use shoelaces instead of a standard process flow or table?
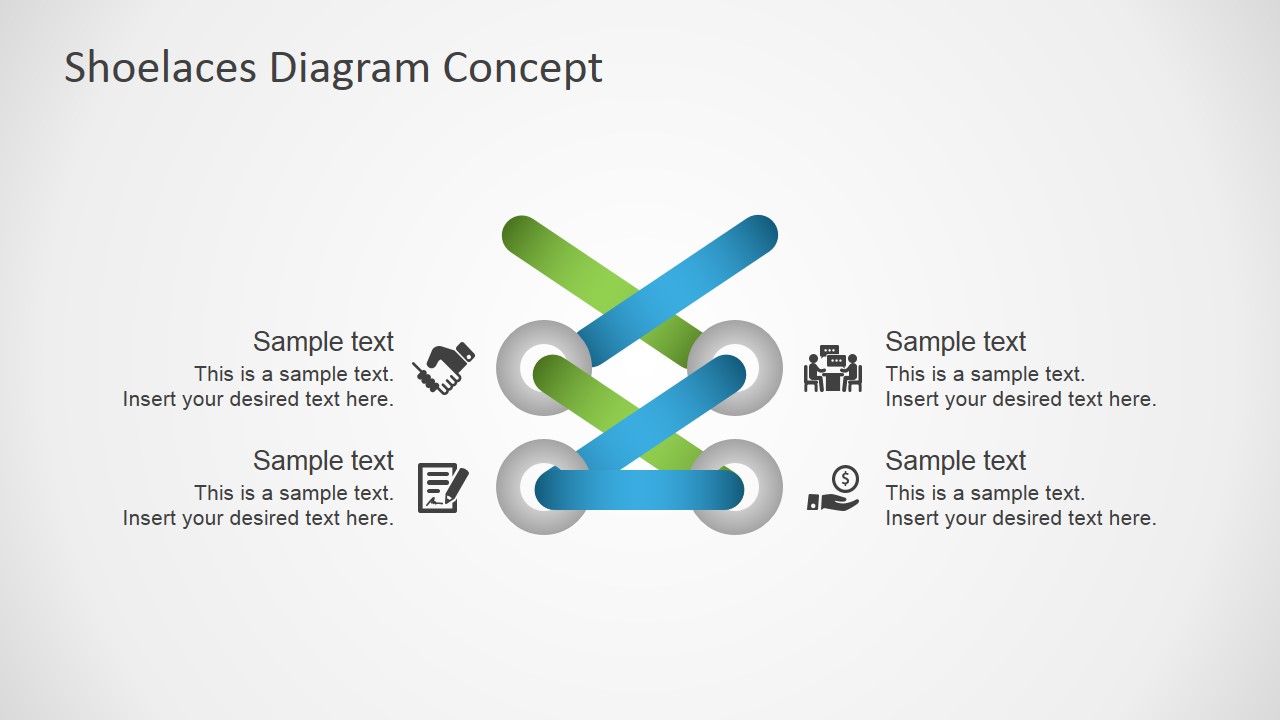
A: The shoelace metaphor makes crossed connections visible without implying a simple linear path. The gray eyelets create anchor points, while the blue and green laces show two intertwined tracks. That helps audiences understand that the topic is tied together, layered, or difficult to untangle.
Shoelaces Diagram Concept for PowerPoint
3-slide diagram presentation template for shoelace metaphor, correlation, and knotty problem explanations
Shoelaces Diagram Concept for PowerPoint is a 3-slide diagram template built around blue and green shoelace paths threaded through gray eyelets. It includes an eight-callout shoelace diagram, a six-callout comparison layout, and a four-callout simplified relationship diagram for business presenters in Microsoft PowerPoint and Google Slides.

 Loading...
 Microsoft PowerPoint
  Microsoft Copilot
  Claude for PowerPoint
 Other formats supported
Subscribe today and get immediate
access to download our PowerPoint templates.