Market Survey Analysis PowerPoint
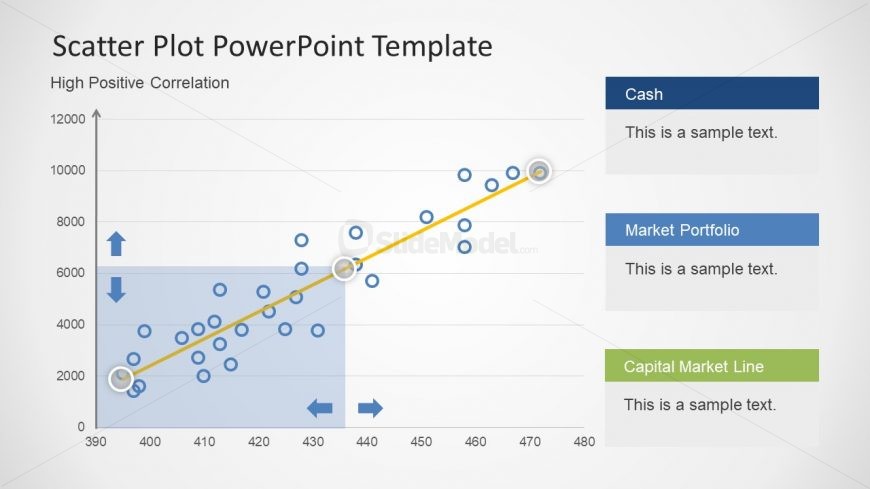
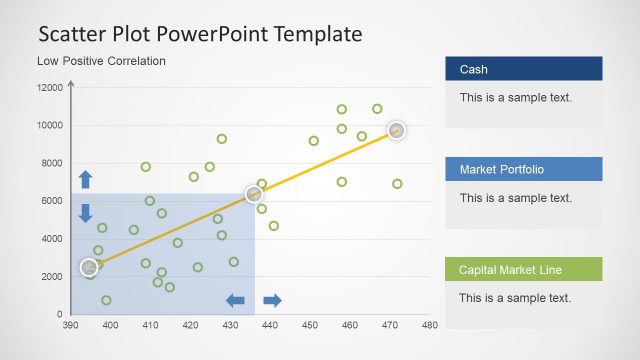
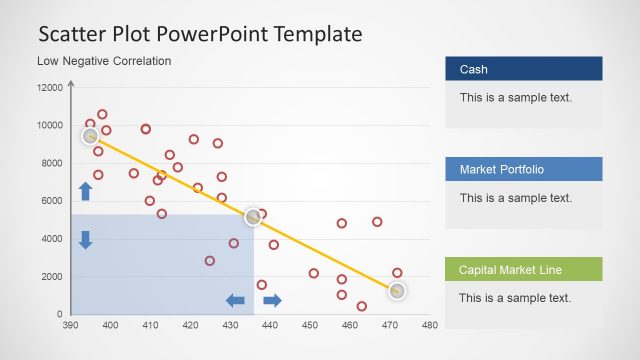
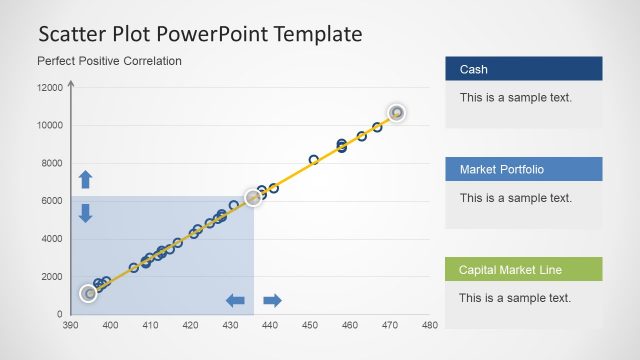
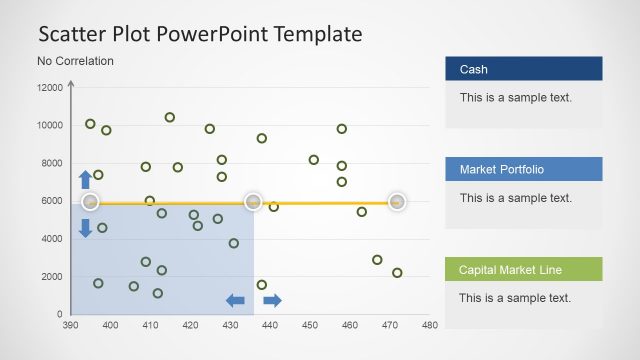
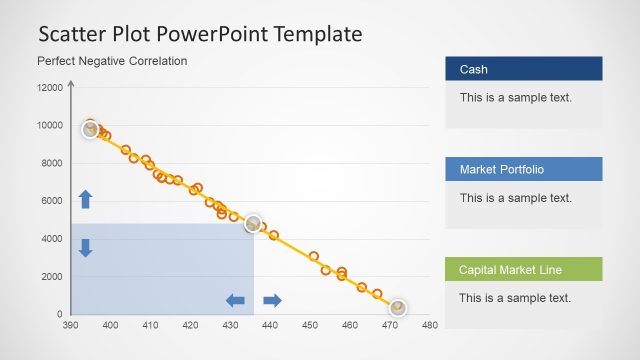
The Scatter Plot PowerPoint Template slide shows high positive correlation diagram. It is a data driven diagram of statistical calculations. With the help of this feature, users can add and modify values which automatically updates the graph. The important feature helps save time and going back and forth into the excel file to update value. This can be done by selecting a diagram, click on the funnel button on the right and update a small excel dialogue box. It is a fantastic way to represent the specialization thesis report to the board or panel.