FinTech Industry by Geography PowerPoint
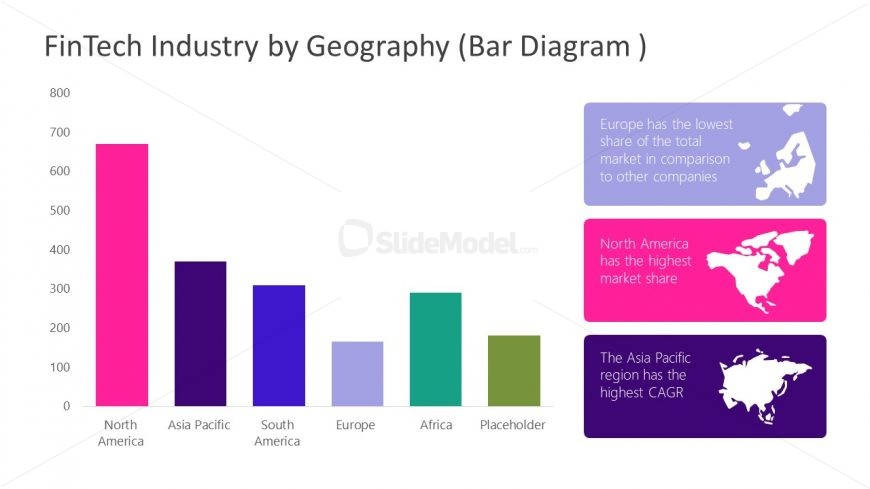
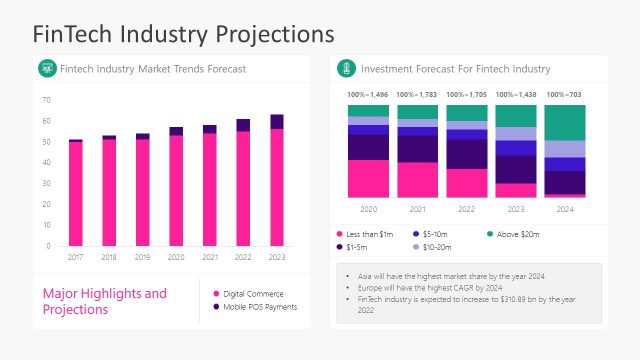
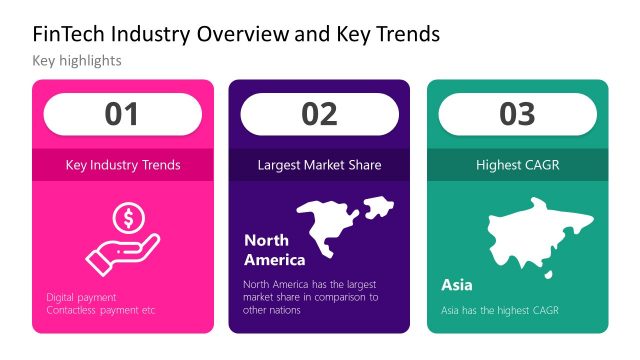
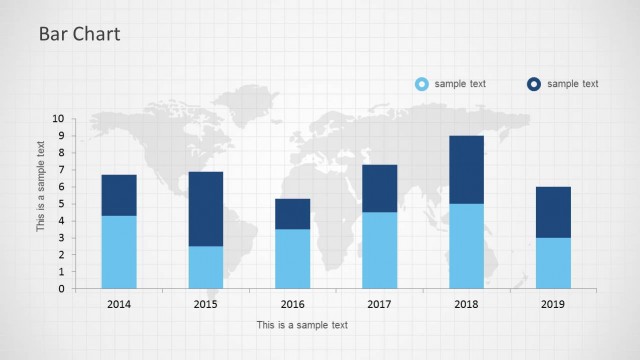
This is a data-driven bar chart to showcase fintech market share stats by geographical region. The slide will assist in visualizing the landscape of fintech industry using simplified continental map segments. A simple data-driven bar chart shows that North America is the largest region in FinTech market followed by Asia Pacific. The fintech industry template could be used for more statistics and facts about financial technology industry using editable charts.
Return to FinTech Industry PowerPoint Templates.