RPE Scale Intensity Chart PowerPoint Template
Showcase the traits of physical performance to your trainees with our RPE Scale Intensity Chart PowerPoint Template. RPE, or Rate of Perceived Exertion, is a scale that measures how your body is performing in a physical activity. It assesses the intensity of exercise based on the physical efforts of the person. The RPE chart has multiple use cases. In fitness training and gym coaching, the RPE chart helps individuals assess the impact of their gym exercises and tailor specific workouts. In cardio or endurance workouts, the RPE chart lets them accurately pace their swimming, running, or cycles. They can ensure that they do not undertrain and avoid exertion. RPE charts are also helpful for DPTs in maintaining intensity levels in physiotherapy.
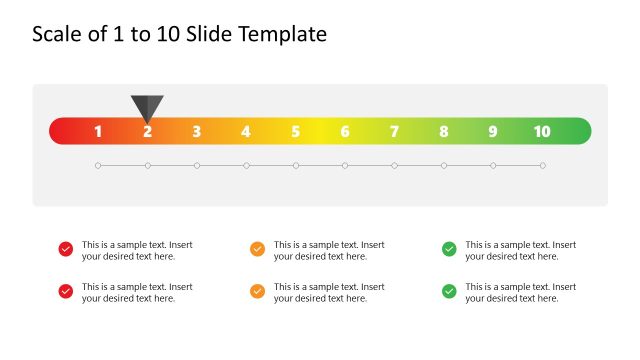
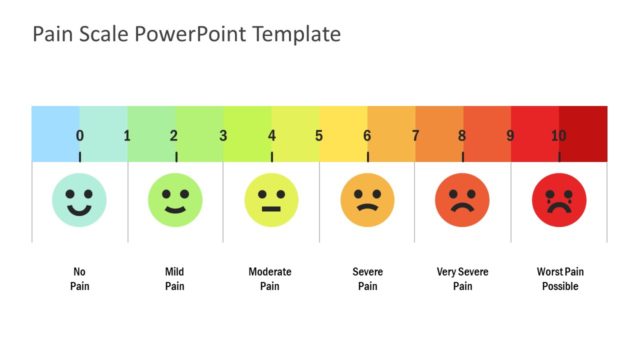
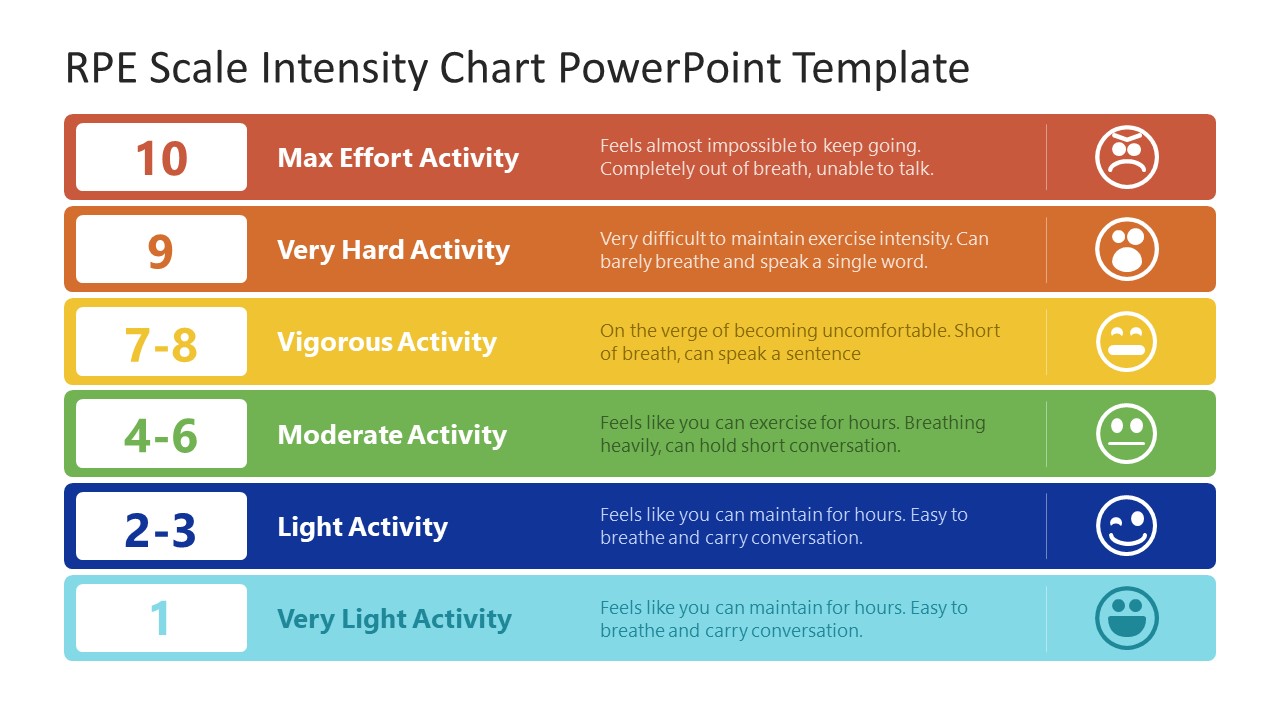
We have created this template for professionals to showcase the chart parameters to the audience in rehabilitation, sports, or wellness sessions. Also, you can edit the template to use in printed formats and paste it on gym or health center walls. The RPE Scale Intensity Chart PowerPoint Template has two slides with the same design but with some variations. The slide layout shows six horizontal rows, each with a distinctive color. The RPE chart has six levels, which are values on a scale of 1-10. These levels and their corresponding scale values are:
- Max Effort Activity (10)
- Very Hard Activity (9)
- Vigorous Activity (7-8)
- Moderate Activity (4-6)
- Light Activity (2-3)
- Very Light Activity (1)
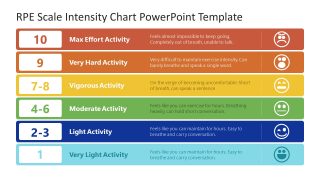
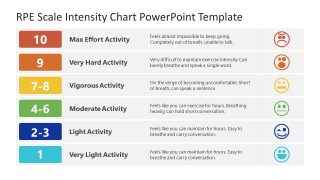
Each row has a scale value, activity name, and activity level description. In the end, a simple emoji showcases expressions of happiness, sadness, or tiredness based on the intensity level of the exercise. The second slide has a similar design to the first one, but the color combination is altered. The colored parts are white, and the white parts are colored. You can redesign the template based on your theme needs. Download the RPE scale template and edit it now!

You must be logged in to download this file.
DOWNLOAD- Category
- Text & Tables
- Rating

 Loading...
- Size
- 16x9
- Item ID
- 22929-01
- Colors
Subscribe today and get immediate
access to download our PowerPoint templates.