Slide 2 of 2 from Rostow's Development Stages PowerPoint Template
Rostow’s Development Stages Template Slide
Rostow's Development Stages Diagram
- Diagram
- Process Flow
- Process Slide
- 16:9
- 100% Editable
What’s on This Slide
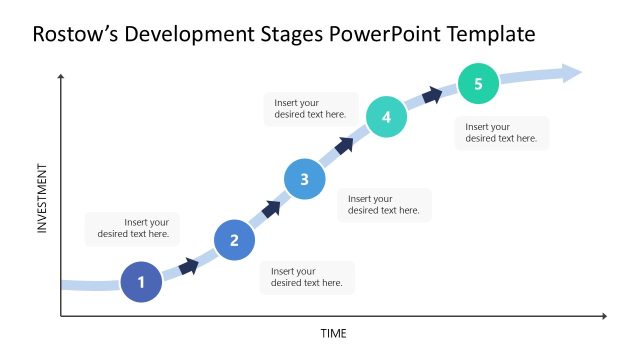
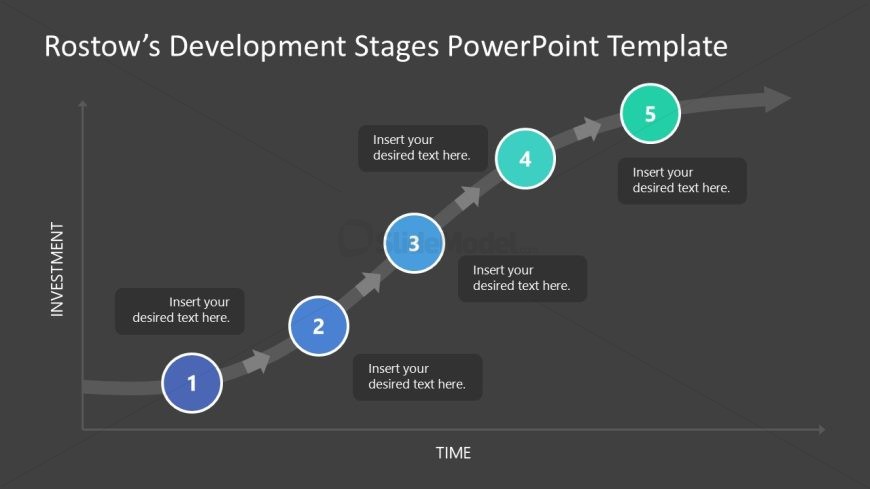
The slide features a diagonal flowchart with five circular nodes labeled 1 to 5, representing stages over time. The nodes are positioned along a curved arrow, indicating progression. The vertical axis is labeled 'INVESTMENT,' while the horizontal axis is labeled 'TIME.' Each node contains a text placeholder centered within, allowing for stage-specific descriptions. The background is dark gray, providing contrast to the white and teal node colors. The overall layout emphasizes a clear visual hierarchy, guiding the viewer's eye along the flow of development stages.
How to Use It
This layout serves as a process flow diagram, illustrating Rostow's stages of economic development. It is effective for presentations discussing business growth strategies, economic models, or investment timelines. This slide fits well after a problem-framing slide, helping to transition into a discussion of solutions or strategies. It is suitable for educational contexts, business meetings, or economic analyses where a visual representation of development stages is needed.
Text Placeholders & Capacity
Keep your copy within these limits so it fits without resizing. Node body slots can hold approximately 50 characters each.
| Placeholder | Count | Max characters (approx.) |
|---|---|---|
| Item heading | 5 | 30 |
| Item body | 5 | 50 |
Slide Keywords
Download unlimited PowerPoint templates, charts and graphics for your presentations with our annual plan.
DOWNLOAD