Slide 1 of 3 from Push & Pull Factors Infographic PowerPoint Template
Editable Push & Pull Factors Infographic Presentation Template
Push and Pull Factors Infographic Slide
- Diagram
- Comparison Split
- Context Slide
- 16:9
- 100% Editable
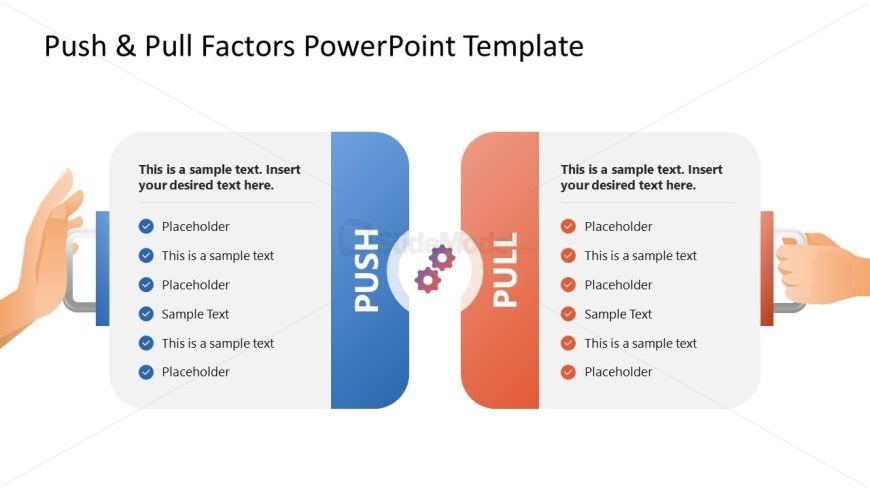
The Push and Pull Factors Diagram from the Push & Pull Factors Infographic PowerPoint Template offers a clear visual comparison ideal for marketing analysis and decision-making frameworks. This slide layout uses editable shapes and vector icons to differentiate factors influencing behavior, making it a practical addition to business presentations or educational slide decks.
What’s on This Slide
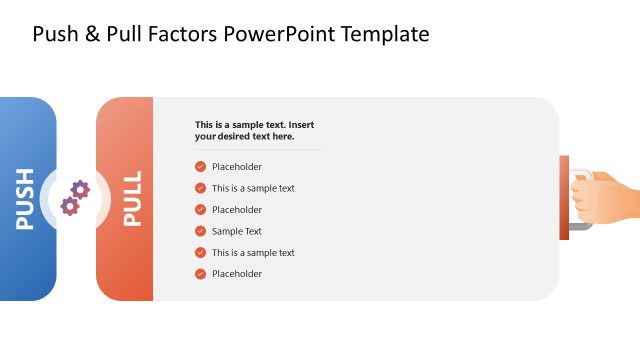
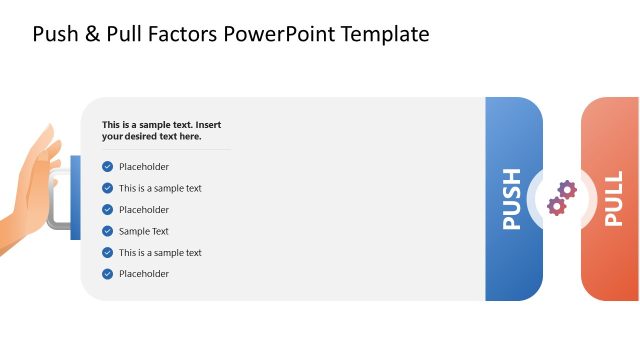
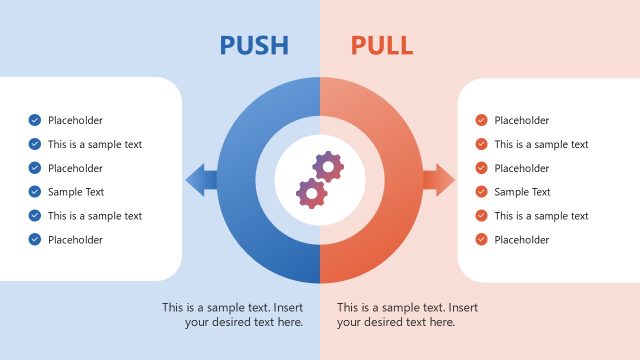
The layout features two vertical sections labeled 'PUSH' and 'PULL' on the left and right, respectively. Each section contains a series of text placeholders aligned vertically, with checkmark icons next to some entries. The background is a light color, enhancing the visibility of the blue and orange sections. The central area includes a gear icon, symbolizing interaction between the two sides. Text placeholders are centered within their respective sections, allowing for clear differentiation between push and pull factors. The overall composition is balanced, with hands depicted on the outer edges, suggesting action.
How to Use It
This layout serves as a comparative diagram, illustrating the push and pull factors in a specific context. It is suitable for presentations discussing decision-making, marketing strategies, or factors influencing behavior. Positioned early in a presentation, it can introduce key concepts before delving into detailed discussions. This structure is effective for visualizing dual aspects of a topic, making it useful in business, education, or social science contexts where contrasting elements are analyzed.
Text Placeholders & Capacity
Keep your copy within these limits so it fits without resizing. Node body slots can hold up to 40 characters each.
| Placeholder | Count | Max characters (approx.) |
|---|---|---|
| Item body | 6 | 40 |
| Slide title | 1 | 50 |
Slide Keywords
Download unlimited PowerPoint templates, charts and graphics for your presentations with our annual plan.
DOWNLOADReturn to Push & Pull Factors Infographic PowerPoint Template.