Slide 2 of 3 from Push & Pull Factors Infographic PowerPoint Template
Customizable Push & Pull Factors Infographic Template
Push and Pull Factors Infographic Slide
- Diagram
- Comparison Split
- Concept Explanation Slide
- 16:9
- 100% Editable
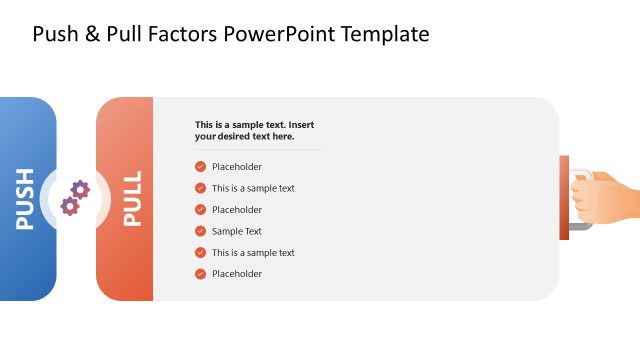
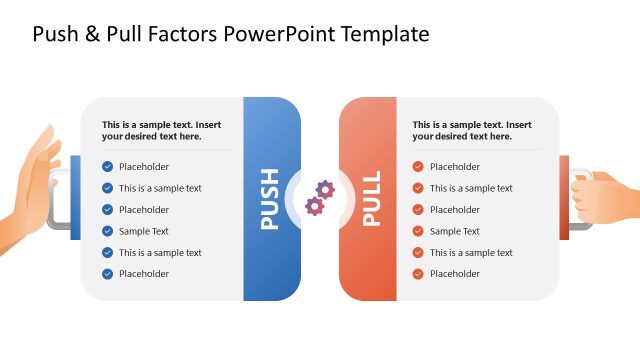
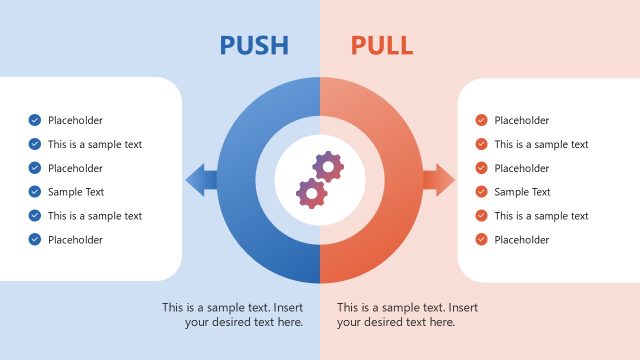
The Push and Pull Factors Layout from the Push & Pull Factors Infographic PowerPoint Template offers a clear visual comparison tool ideal for business presentations and market analysis. This slide template uses distinct color-coded sections and editable shapes to highlight contrasting motivations or market dynamics effectively. Its design supports concise communication of complex concepts, making it a practical choice for corporate presentations and pitch decks requiring detailed factor analysis.
What’s on This Slide
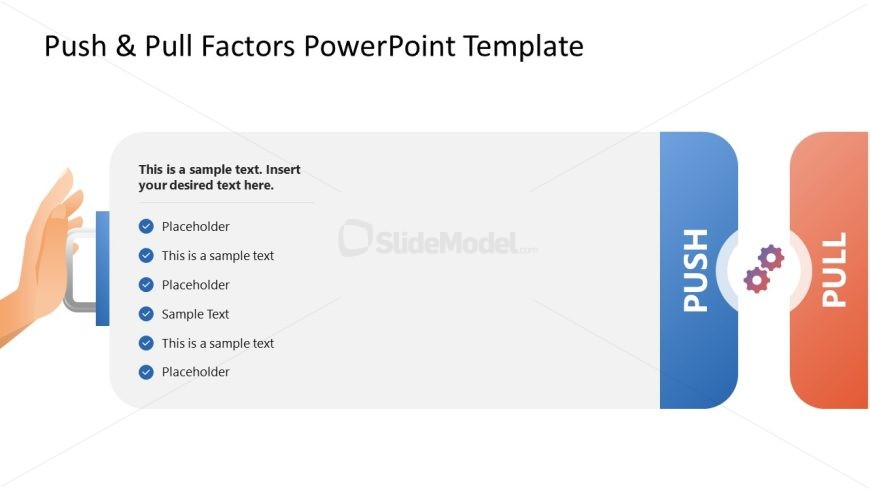
The layout features a central text area bordered by two distinct sections labeled 'PUSH' and 'PULL' on the left and right, respectively. An illustration of a hand is positioned on the left, interacting with a mechanism. The central area contains multiple text placeholders aligned vertically, with checkmarks indicating list items. The placeholders are arranged in a single column, with the top placeholder slightly larger to denote hierarchy. The background is predominantly white, enhancing readability, while the 'PUSH' section is blue and the 'PULL' section is orange, providing a clear visual distinction.
How to Use It
This layout serves as a comparative analysis tool, effectively illustrating push and pull factors in various contexts. It is suitable for presentations discussing motivation, decision-making, or market dynamics. The structure fits well between introductory content and detailed analysis, allowing for a clear visual representation of contrasting elements. It is particularly useful in business, marketing, and social sciences to highlight influencing factors in a structured manner.
Text Placeholders & Capacity
Keep your copy within these limits so it fits without resizing. Node slots can accommodate roughly 6-8 words each.
| Placeholder | Count | Max characters (approx.) |
|---|---|---|
| Item body | 6 | 50 |
Slide Keywords
Download unlimited PowerPoint templates, charts and graphics for your presentations with our annual plan.
DOWNLOADReturn to Push & Pull Factors Infographic PowerPoint Template.