Profitability Matrix PowerPoint Template
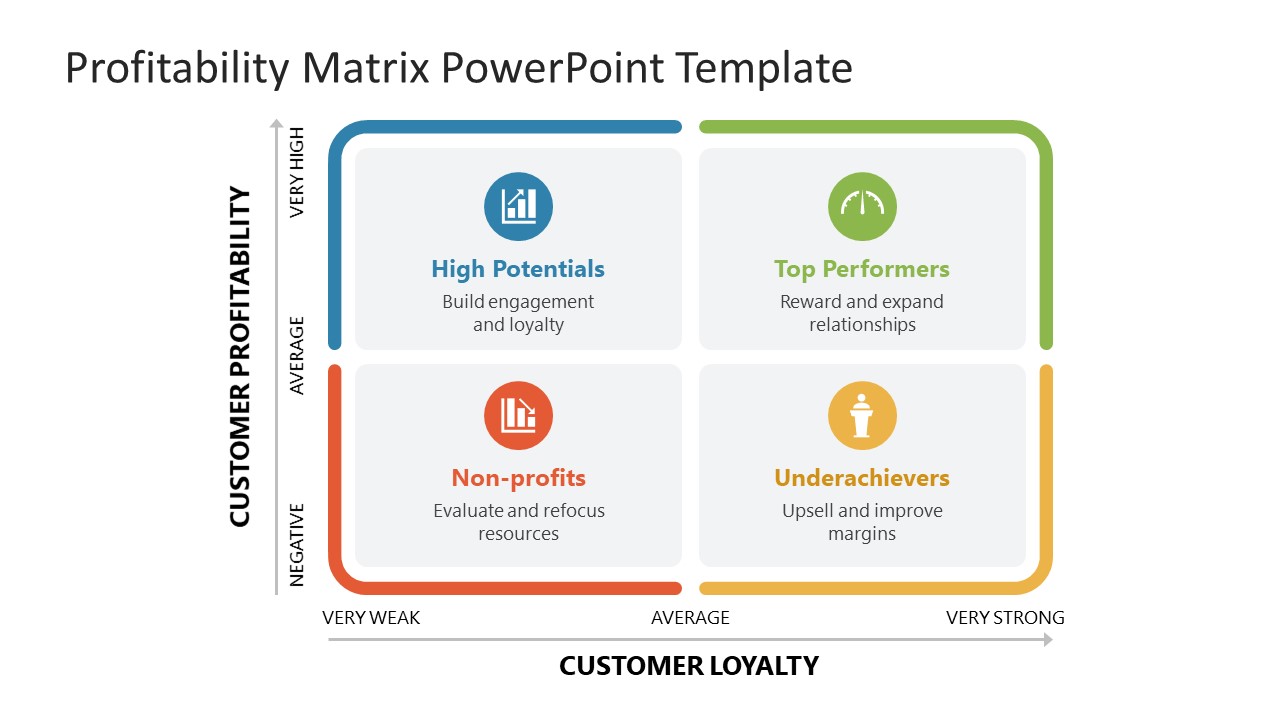
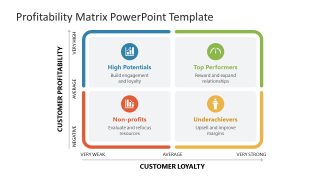
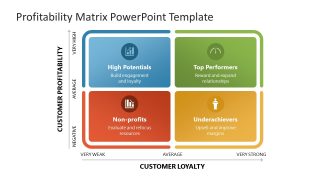
Download our customizable Profitability Matrix PowerPoint Template to showcase the organization’s profitability based on the customers. Companies strive to win loyal customers. The more faithful and connected the customer is with the brand, the higher the chances are that they will return to make another purchase and recommend it to others. We have created this template to enable professionals to assess the potential of their customer base during strategic decision-making sessions. This helps board members revisit their customer targeting and make necessary improvements, while also focusing on the top performers. This template has a 2×2 grid plotting two elements on the axes of the graph. Depending on the position of the value in the grid, the elements are categorized as follows.
- Customer Loyalty (Very Weak, Average, Very Strong)
- Customer Profitability (Negative, Average, Very High)
The matrix diagram features colors in blue, green, red, and yellow. Based on the grid metrics, you can display the following categories of customers in the marketing or sales sessions:
- High Potentials(Build engagement and loyalty)
- Top Performers(Reward and expand relationships)
- Non-Profits(Evaluate and refocus resources)
- Underachievers (Upsell and improve margins)
The Profitability Matrix PowerPoint Template is also compatible with Google Slides and other versions of Microsoft PowerPoint. You can adjust the color scheme of the template to perfectly fit your needs. Further, professionals have the option to repurpose the template and showcase other business matrices in a comprehensive format. The template has two slides. The first slide has a central graph with two axes and colorful borders, while the second slide has colorful segments with borders. Business analysts, data experts, marketing professionals, and sales professionals can easily use the template and edit its components. Download the profitability matrix PPT slide template for your essential business discussions!

You must be logged in to download this file.
DOWNLOAD- Category
- Matrix Charts
- Rating

 Loading...
- Size
- 16x9
- Item ID
- 23283-01
- Colors
Subscribe today and get immediate
access to download our PowerPoint templates.