Commodities Production PowerPoint Template

Farming Commodities PowerPoint Slide

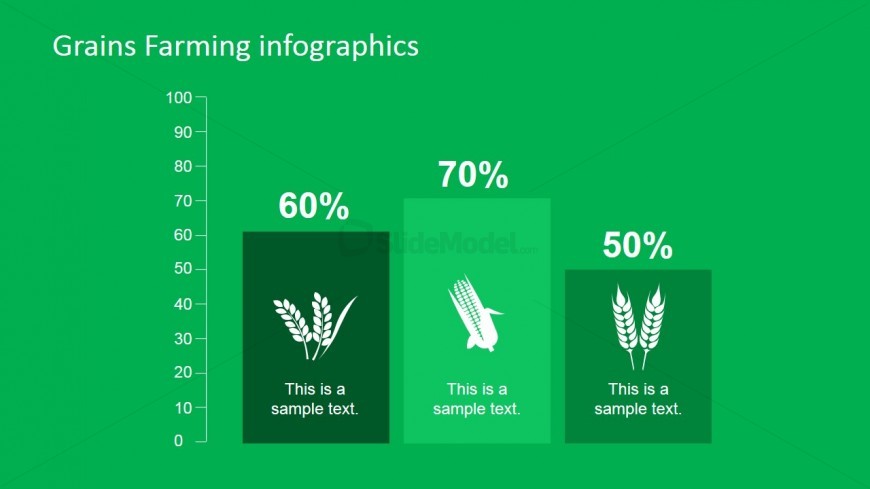
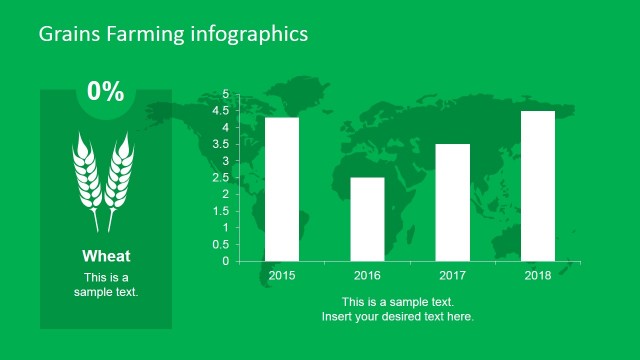
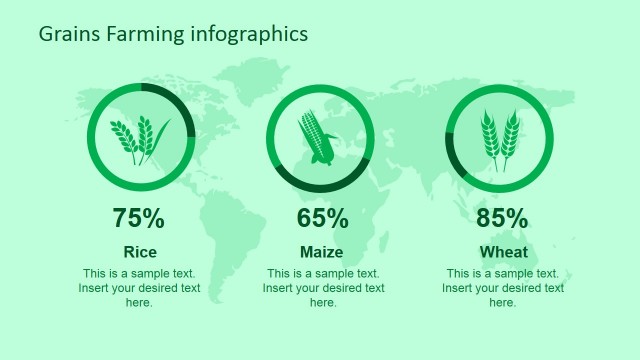
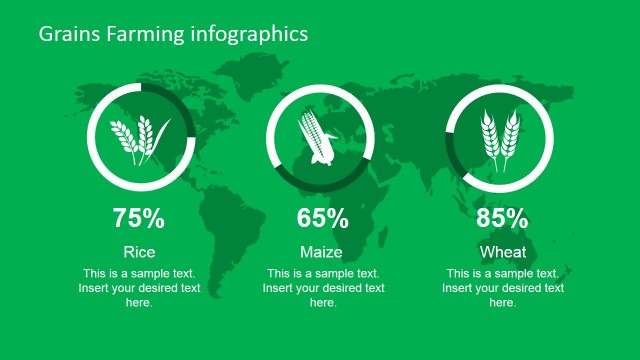
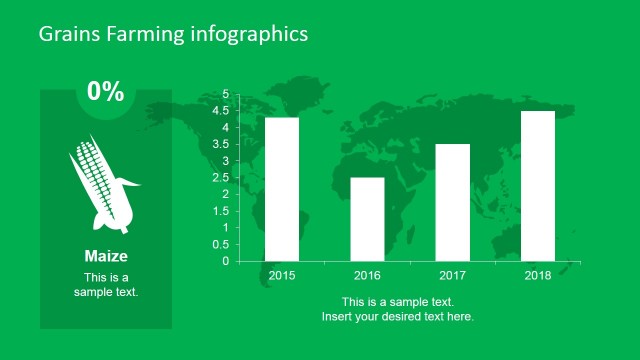
This PowerPoint slide illustrates a comparative chart between rice, maize and wheat production. Regions or countries can be incorporated in this template which is useful in presenting business potentials for the grain production and consumption in various locations. Since this slide can be replicated, a separate slide can focus on production per country and year, another in consumption per country or location per year and other similar set up.

Return to Professional Farming Grains PowerPoint Infographic.

Activate your subscription

Download unlimited PowerPoint templates, charts and graphics for your presentations with our annual plan.

DOWNLOAD

Slide Tags:

Background Chart Clip Art Clipart Commodities Corn Donut Doughnut Chart Icons Infographics Maize Percentage Rice Textbox Wheat Worldmap

Return to Professional Farming Grains PowerPoint Infographic.

Download Unlimited Content

Our annual unlimited plan let you download unlimited content from SlideModel. Save hours of manual work and use awesome slide designs in your next presentation.

Subscribe Now