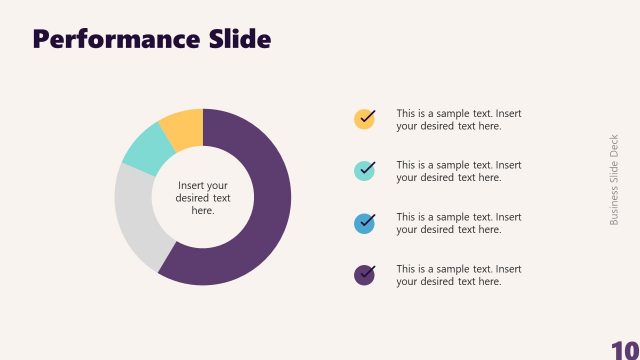
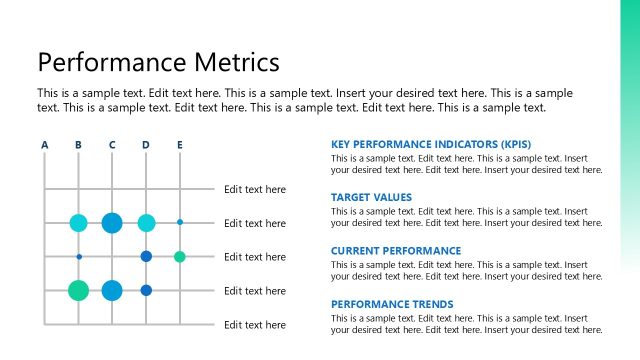
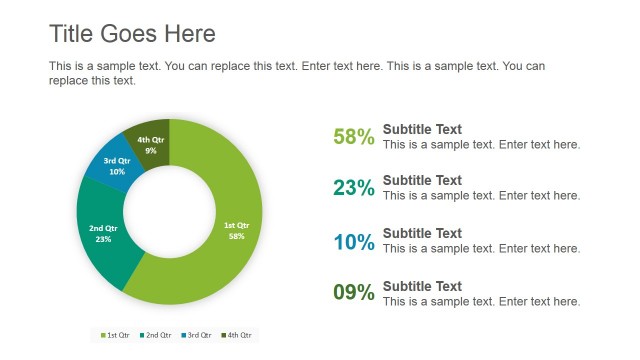
Performance Presentation Doughnut Chart
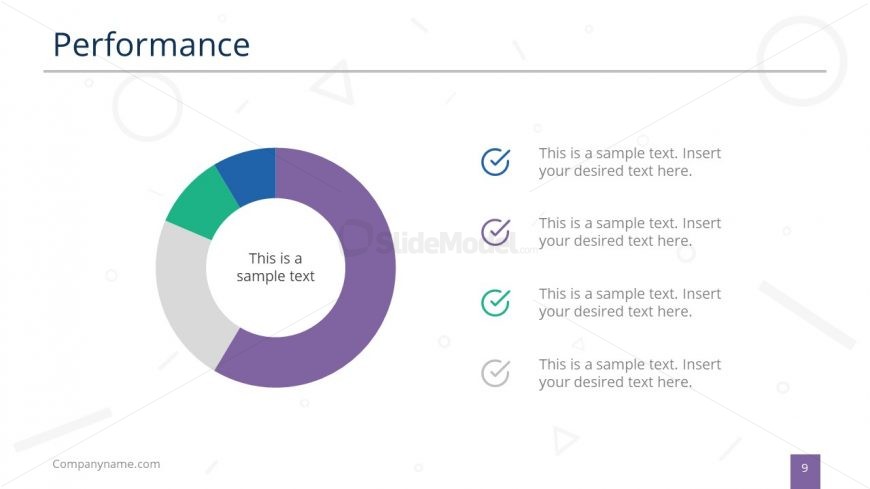
The Performance Presentation Doughnut Chart is the PowerPoint slides containing donut chart. It is a data driven PowerPoint graph which enables the presenter to change values in run time and it will update them automatically. The template is a two contents layout with data chart on left and bullet list format on right. It could assist in presenting sales, use of resources and budget for each process etc. Use the filter icon to select data and enter values. The select data link gives the option to add numerical values in the excel sheet and apply calculations.
Return to Professional Business Slide Deck PowerPoint Template.