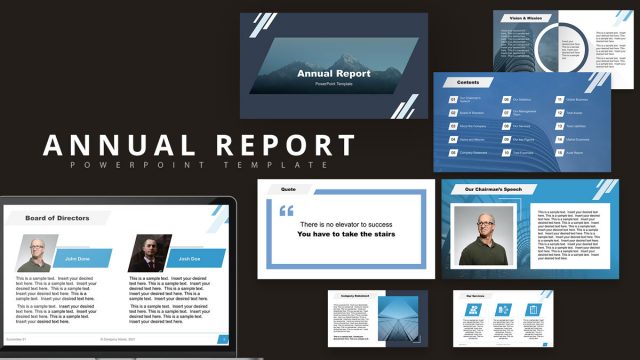
Professional Annual Report PowerPoint Template is a compelling PowerPoint template containing creative slides that you can use to make an annual report PowerPoint presentation. An annual report is a comprehensive report on a company’s activities throughout the preceding year and for that purpose we have included creative business slides and layouts containing diagrams, timelines and presentation agenda slides that you can use to describe your company’s activities.
Inside this presentation template you can find:
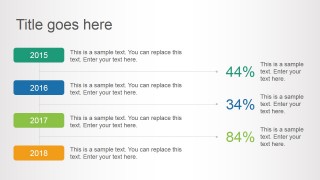
- Timeline slide designs.
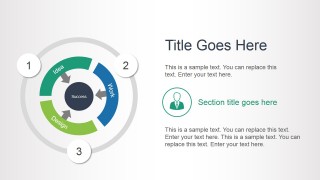
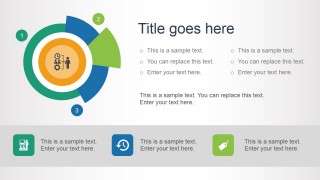
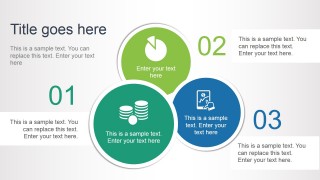
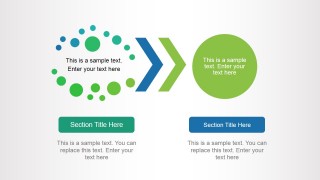
- Circular diagrams for process flow description.
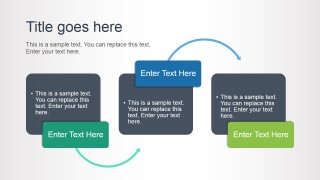
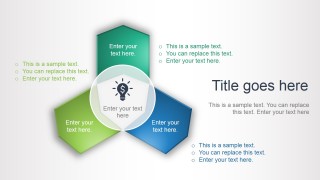
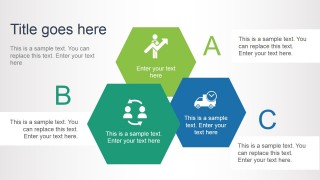
- Slide layouts with space for A, B and C points.
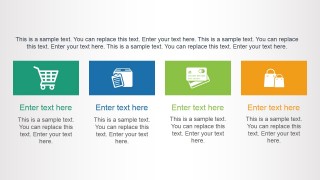
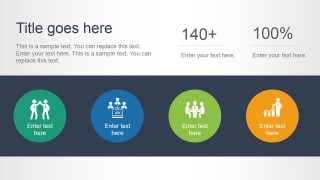
- Presentation agenda slides and layouts for key concepts.
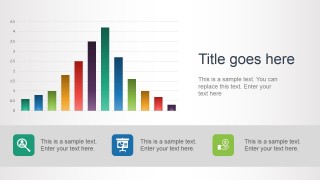
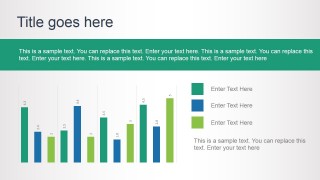
- Data-driven charts with custom slide layout.
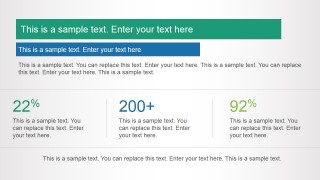
- Slides to describe your KPI and financial indicators.
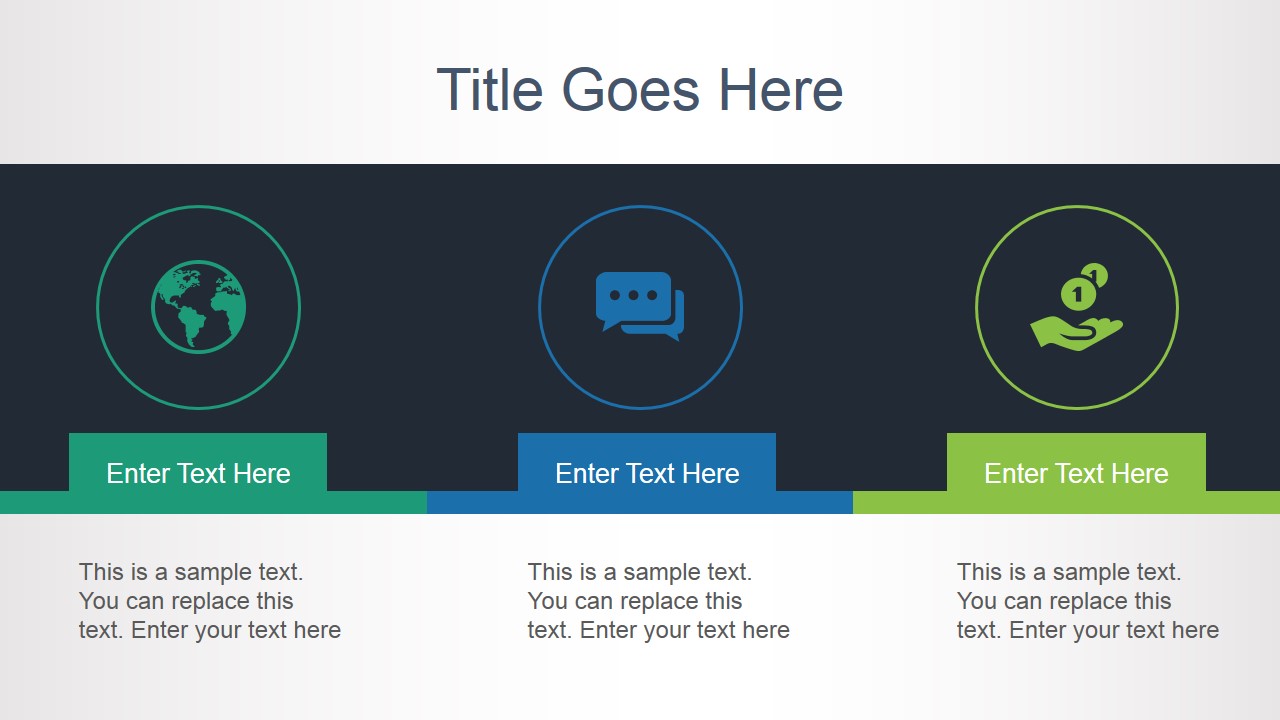
- Creative slide layouts with arrows and PowerPoint icons.
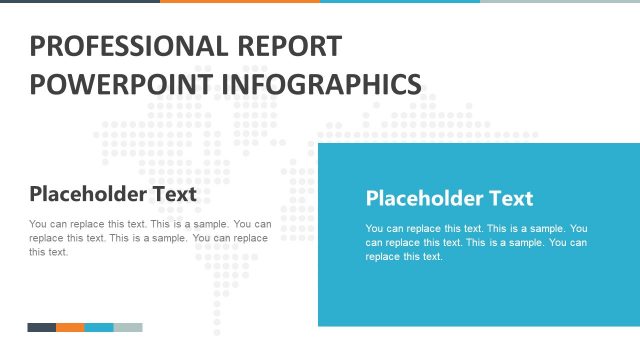
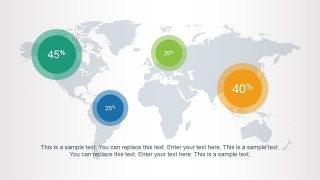
- Slide layouts with world map and map pointers.
By using the annual report template you can give company shareholders information about your company’s activities and financial performance during the preceding year.
What’s inside this template
Example presentation scenarios
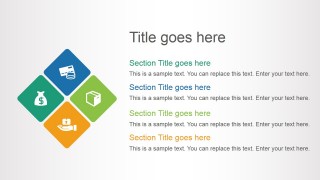
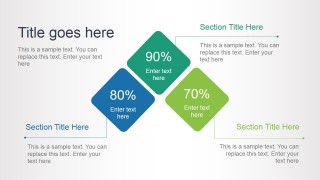
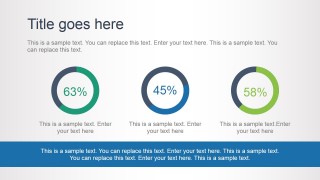
- A CFO can use the KPI gauge charts, bar charts, and percentage diamonds to explain annual financial performance to executives and board members.
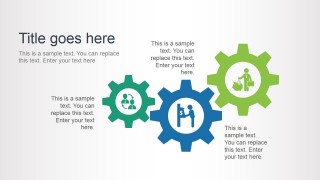
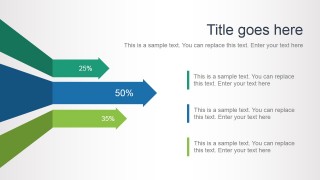
- An operations leader can use the gear diagram, circular process slides, and arrow progress bars to show how major initiatives moved through the year.
- An investor relations presenter can use the timeline list, world map layout, and metric summary slides to organize a shareholder update around milestones and regional performance.
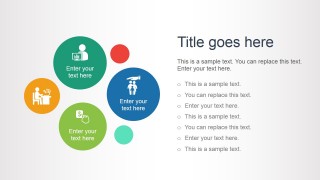
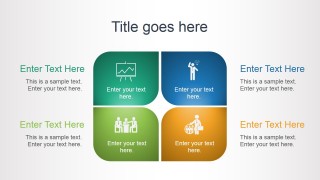
- A department manager can use the agenda cards, icon clusters, and four-quadrant matrix to summarize team priorities, project outcomes, and next-year focus areas.
Features
- 100% editable presentation template
- Compatible with Microsoft PowerPoint and Google Slides
- 16:9 aspect ratio slides
- Scalable vector shapes, icons and illustrations
- AI-Ready for Microsoft Copilot and Claude
- Instant access and download
Frequently asked questions
Q: How should a presenter structure an annual report with these layouts?
A: Start with the agenda and icon cards to frame the reporting categories, then use the timeline, process diagrams, and gear layout to explain what happened during the year. Move into evidence with KPI gauges, percentage comparisons, bar charts, and the world map. Close each section with a short interpretation, not just a metric.
Q: Who is this template best suited for?
A: This template fits executives, finance teams, operations leaders, and analysts who need to report annual activity in a visual business format. It is especially useful when the message combines strategic milestones, process updates, KPI performance, and regional outcomes rather than a single financial table or text-heavy management memo.
Q: Why do the circles, arrows, gears, and map improve the report story?
A: The visual metaphors separate different kinds of business evidence. Gears suggest operational mechanisms, arrows show movement or progress, circular diagrams group related initiatives, and the map places results in geographic context. This helps the audience recognize whether each slide is explaining cause, sequence, category, or location.


Professional Annual Report PowerPoint Template
24-slide annual report presentation template with timelines, KPI charts, process diagrams, and maps
Professional Annual Report PowerPoint Template is a 24-slide annual report deck for business performance updates in Microsoft PowerPoint and Google Slides. It includes agenda cards, circular process diagrams, arrow timelines, KPI percentage slides, bar charts, and a world map layout for shareholders, executives, and planning teams. Chart data can be edited as an Excel spreadsheet in PowerPoint.
- Category
- Business PowerPoint Templates
- Rating


 Loading...
- Aspect ratio
- 16:9
- Item ID
- 4069-01
- Colors
 Microsoft PowerPoint
 Microsoft Copilot
 Claude for PowerPoint
Other formats supported
Subscribe today and get immediate
access to download our PowerPoint templates.