Slide 9 of 15 from Orange Business PowerPoint Template
6085-06-orange-gray-company-profile-9
Line Chart for Data Visualization
- Chart
- Line Chart
- Evaluation Slide
- 16:9
- 100% Editable
The Line Chart slide from the Orange Business PowerPoint Template offers a clear visual format for trend analysis and performance reporting. This slide layout includes editable shapes and vector icons to enhance data presentation, making it suitable for business presentations and sales forecasting within a professional slide deck.
What’s on This Slide
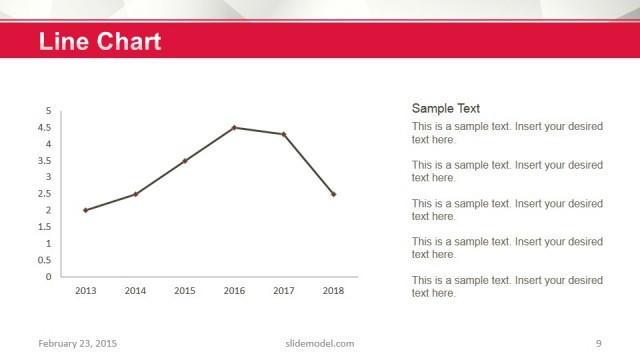
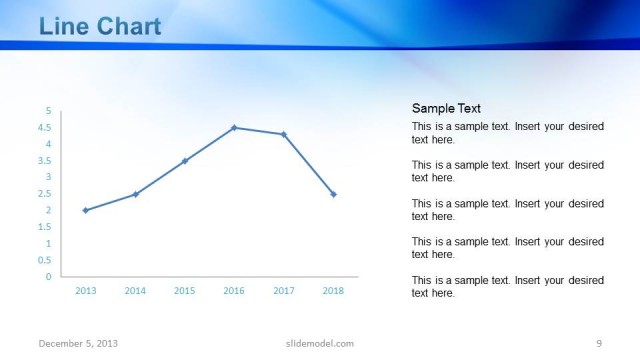
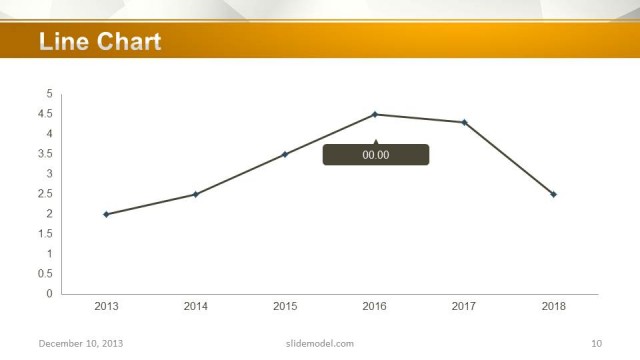
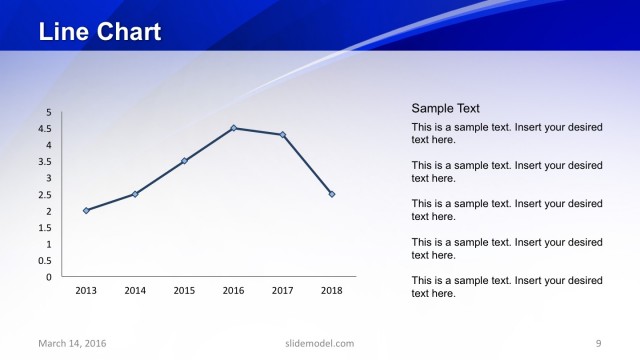
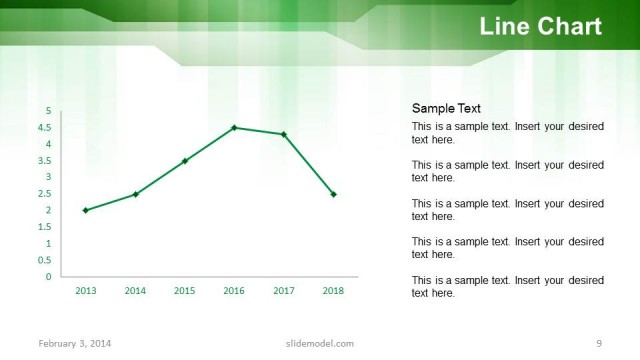
The slide features a line chart positioned centrally, displaying data points along a horizontal timeline from 2013 to 2018. The vertical axis ranges from 0 to 5, marked with evenly spaced intervals. Data points are connected by a black line with diamond-shaped markers indicating values. To the right, there is a text placeholder for sample text, aligned vertically and occupying the right half of the slide. The title 'Line Chart' is prominently displayed at the top in a large font. The background includes a light gradient with a subtle pattern.
How to Use It
This layout serves as a data visualization tool, ideal for presenting trends over time. It fits well in a presentation sequence following problem identification and before strategic recommendations. This slide is suitable for business scenarios such as performance tracking, sales growth analysis, or market trend presentations. It can be used to illustrate key metrics or changes in data over specified periods, providing a clear visual reference for stakeholders.
Text Placeholders & Capacity
Keep your copy within these limits so it fits without resizing. Body slots can hold roughly 10 words each.
| Placeholder | Count | Max characters (approx.) |
|---|---|---|
| Chart title | 1 | 20 |
| Body paragraph | 5 | 50 |
Slide Keywords
Download unlimited PowerPoint templates, charts and graphics for your presentations with our annual plan.
DOWNLOADReturn to Orange Business PowerPoint Template.