Ohio State PowerPoint Map
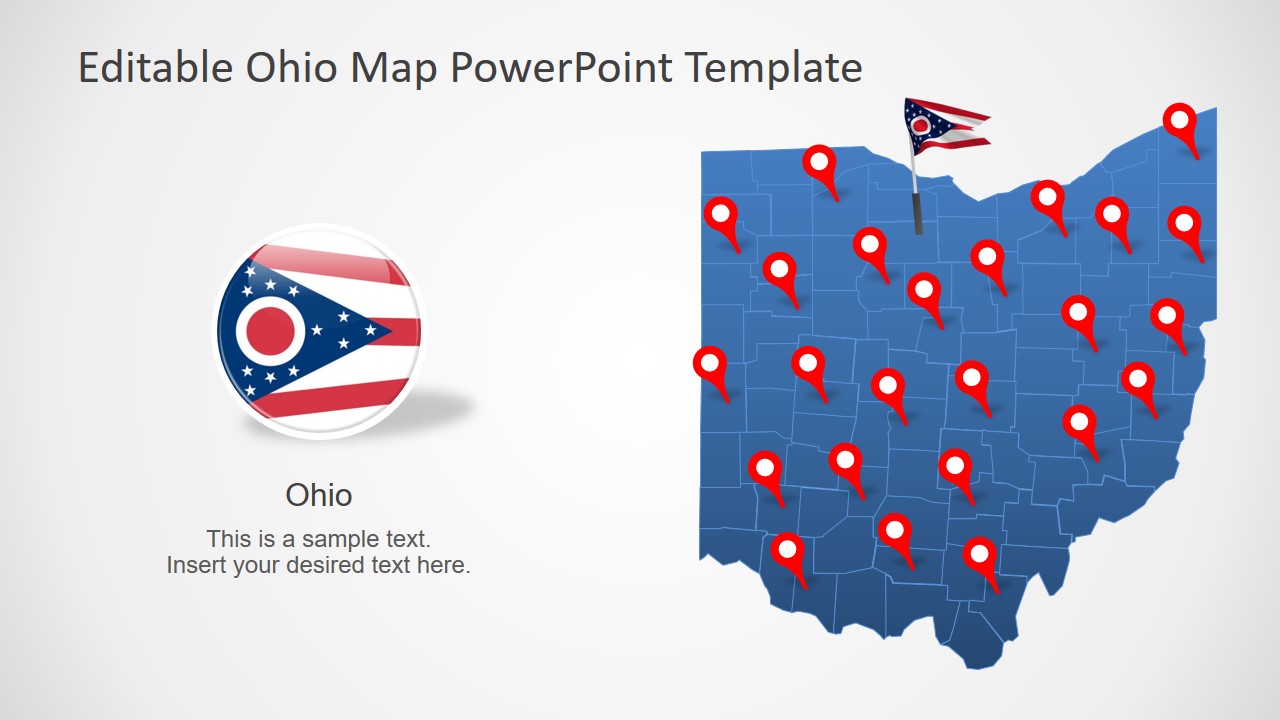
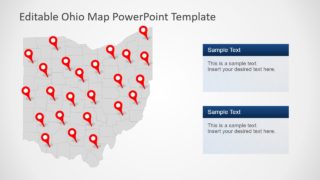
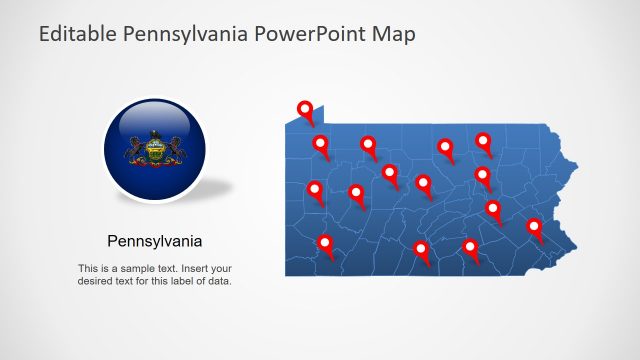
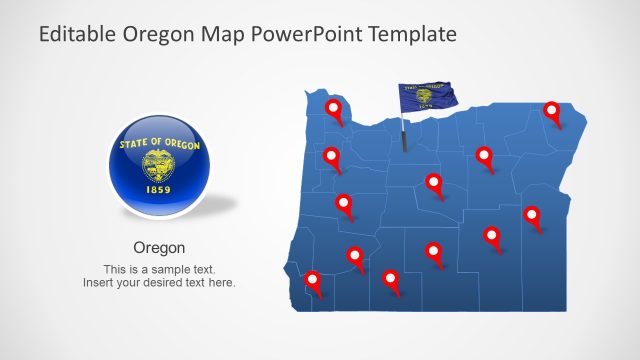
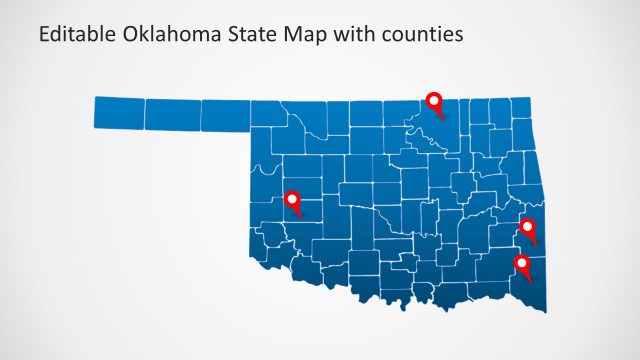
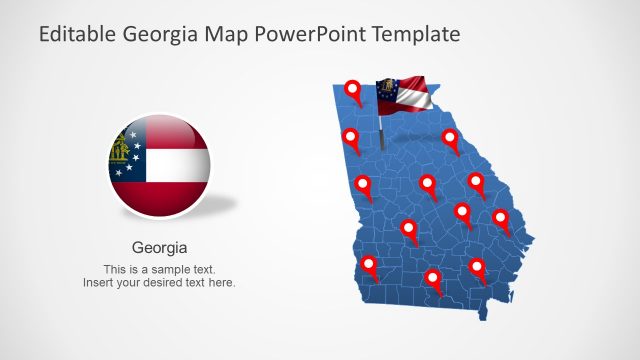
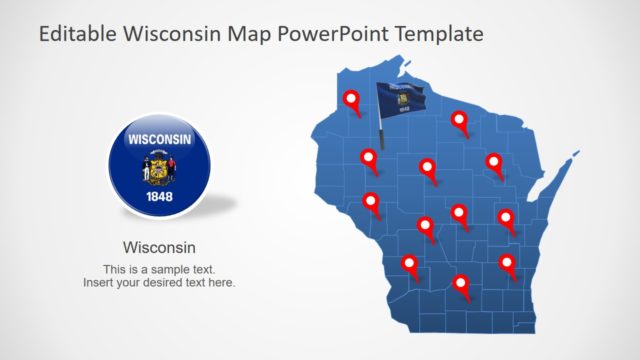
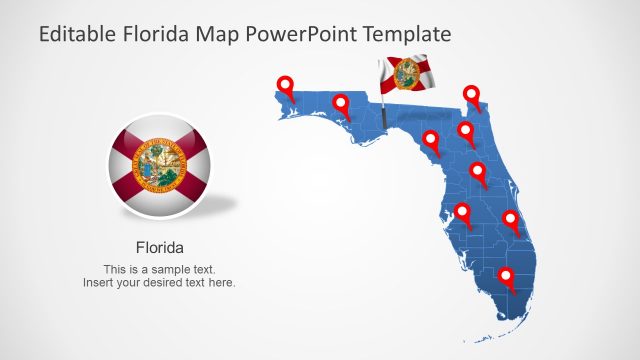
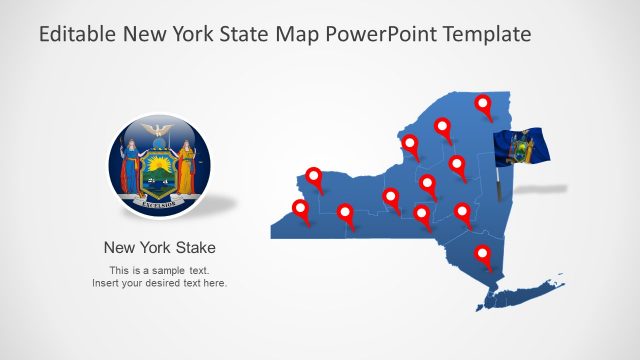
The Ohio State PowerPoint Map is an editable outline map for a range of presentations. These may including demographics, businesses and research surveys. Because the maps outline and help labeling multiple counties and major cities for the USA state of Ohio. The template contains 7 slides that offer several version of a similar map. Whereas, elements such as location pins, PowerPoint shapes, flags, and text placeholders are useful graphics. Since these elements complement the textual content of slides. For instance, describing age statistics of different regions or creating a target market in area.
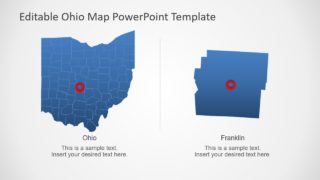
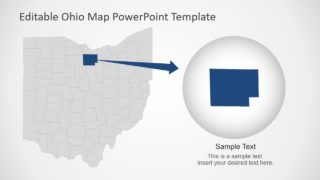
The editable PowerPoint map template of Ohio State include two slides that feature zoom-in presentation slides. For example, the 5th slide highlights Franklin state by using an enlarge shape to depict zoom-in. However, users can also try a Zoom feature of PowerPoint from insert menu, available in PowerPoint 2016. Furthermore, the PowerPoint template contains silhouette maps in blue and gray colors. But users can change colors of these maps or individual county segments from shape fill option in format menu.
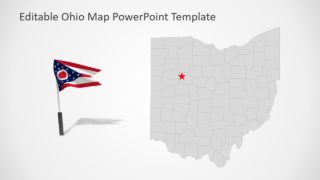
The Ohio State PowerPoint Map is an ideal slide deck for educational purposes. Because it offers appealing visual graphics to learn about regional geography. The 7 slides could be helpful in discussing topics like State flag, history, motto, etc. Similarly, the analysts and market researchers an reduce the effort of using numbers and charts by displaying statistics on maps.
