Market Research Diagram PowerPoint Template
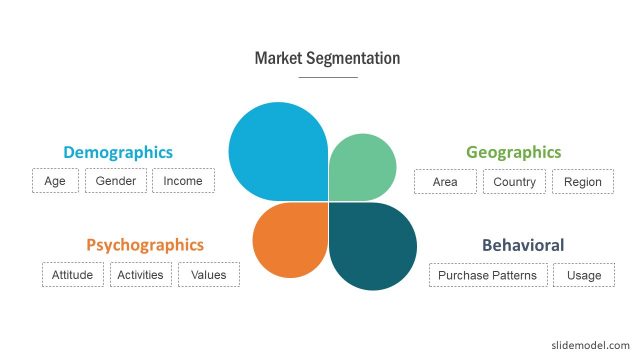
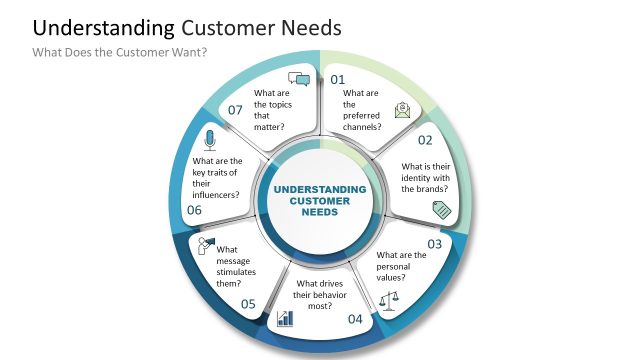
The Market Research Diagram PowerPoint Template is a concept design for marketing analysis and to be used in business market presentations. A key to business success is in understanding customer needs and deliver it at profit. The process of analyzing customer needs can be covered in a market research study. It involves systematic data collection of target market i.e. market segmentation.
This analysis of data gives insights into what different groups of people needs. The businesses use market research report data to improve products, strategies, and operations. All market research efforts eventually lead to increase profits as well as effective and more targeted product marketing.
Market research helps organizations to get consumer’s opinions on various aspects of product and business operations. For example, pricing, features, quality, customer support, etc. It is a collection of data from customers, competitors, and ever-changing market trends. Market research is basically a starting point of marketing strategy. Market research methods are divided into two broader terms i.e. Primary and Secondary research. These are further divided into 7 types of market research methods to obtain results:
Primary research – when business conducts its own research using its own data, tools, and results. During planning of primary research, it is important to define Qualitative vs Quantitative tools. A quantitative study refers to collecting data through surveys, questioners, or poles. Whereas, Qualitative study involves close observations such as face-to-face encounters.
The qualitative research methods include:
- Survey polls
- Interviews
- Case study research
- One-on-one interview
- Record keeping
Quantitative research methods include:
- Random sampling
- Systematic operations
- Advanced statistical analysis
- Graphical data representation
- Quantifying a problem
- Deductive reasoning
- Object-based research
Secondary research – Drive conclusions from existing sources to understand competition.
- Online research
- Literature research
- Case study research
Research Presentation templates like this one could be used in all industry types to discuss marketing strategies and gaps. For example:
- Find viability of a business
- understanding the target market
- Polish market strategy
- Best use of marketing tools using well-researched data
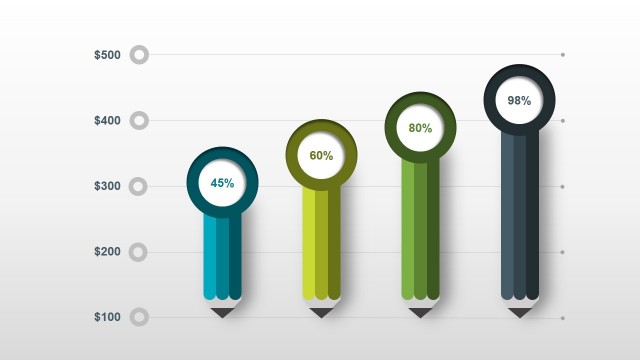
The Market Research Diagram PowerPoint Template contains 4 slides of circular design. It is a suitable diagram for presentations on market research studies. The market research clipart icons and vibrant colors give an infographic effect to the diagram design. Each clipart icons represents a market research method. The multiple variations of diagram design will help focus on primary and secondary research methods separately.


You must be logged in to download this file.
DOWNLOAD- Category
- Diagrams
- Rating

 Loading...
- Size
- 16x9
- Item ID
- 20553-01
- Colors
Subscribe today and get immediate
access to download our PowerPoint templates.